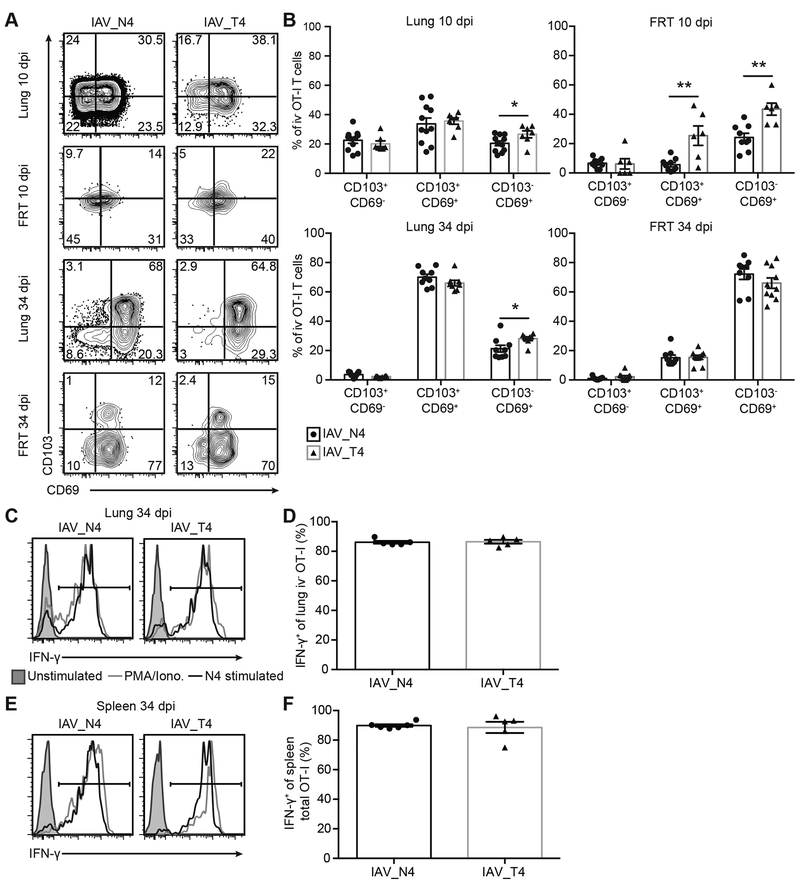
Figure 5. Phenotype of lung TRM cells is independent of TCR signal strength.
Challenged mice were generated as in Figure 1. (A) Representative flow plots of CD69 and CD103 staining on iv− OT-I T cells in the lung and FRT on 10 and 34 dpi from mice. (B) The percentage of iv− OT-I T cells expressing CD103+CD69−, CD103+CD69+ or CD103−CD69+ (C-F) On 34 dpi, lungs (C, D) and spleens (E, F) were harvested and cells were stimulated ex vivo with 1 μg/mL N4 peptide. As a positive control, cells were stimulated with PMA/Ionomycin. (C, E) Representative IFN-γ staining of iv− lung (C) or total spleen (E) OT-I T cells unstimulated, stimulated with PMA/Ionomycin or N4 peptide. (D, F) Percentage of iv− lung (D) or total spleen (F) IFN-γ+ OT-I T cells after ex vivo N4 stimulation. The results (B) are combined from 2 independent experiments with at least 3 mice per group, per experiment (± SEM). The results (D,F) are 1 representative experiment of 2 independent experiments with at least 5 mice per group, per experiment (± SEM). *p < 0.05, ** p < 0.01 (unpaired t test).

