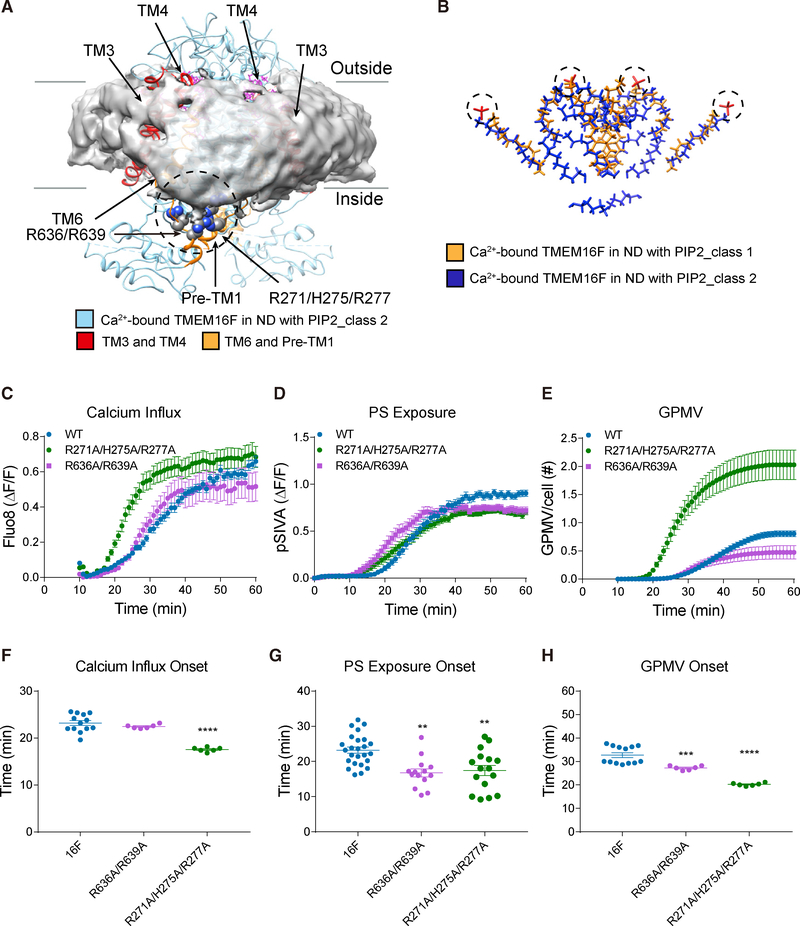
Figure 4. TMEM16F-Conformation-Dependent Orientation of Bound Lipids and Functional Tests of Basic Residues Associated with Membrane Distortion.
(A) Transmembrane helices and loops in ribbon diagram for class 2 TMEM16F (blue) and bound lipids (magenta) shown with distorted membrane (gray). Membrane distortion is near TM3 and TM4 (red) and TM6 and pre-TM1 elbow (orange) with clusters of basic residues (encircled in dashed line) that are tested with mutagenesis.
(B) Superimposition of lipids bound to class 1 (gold) and class 2 (blue) TMEM16F in PIP2-supplemented nanodiscs. Dotted circles mark the lipid headgroups that interact with extracellular loops.
(C–E) Live imaging of TMEM16F-dependent Ca2+ influx (C), PS exposure (D), and GPMV generation (E). Time-lapse imaging of 500–1,000 cells with 10× magnification was performed to concurrently monitor GPMV formation and Ca2+ influx via Fluo-8 fluorescence. Time-lapse imaging of individual cells viewed with 603 magnification was performed to monitor PS exposure via pSIVA fluorescence. Data are represented as mean ± SEM.
(F–H) Scattered dot plots of time of onset of TMEM16F-dependent Ca2+ influx (F), PS exposure (G), and GPMV generation (H). Time of onset could not be determined for those time courses with a linear rather than sigmoidal rise. Data are represented as mean ± SD. *p < 0.05; **p < 0.01; ***p < 0.001; ****p < 0.0001.
Statistical significance of all mutants as compared to TMEM16F WT is determined by one-way ANOVA followed by Holm- Šídák multiple comparisons test.

