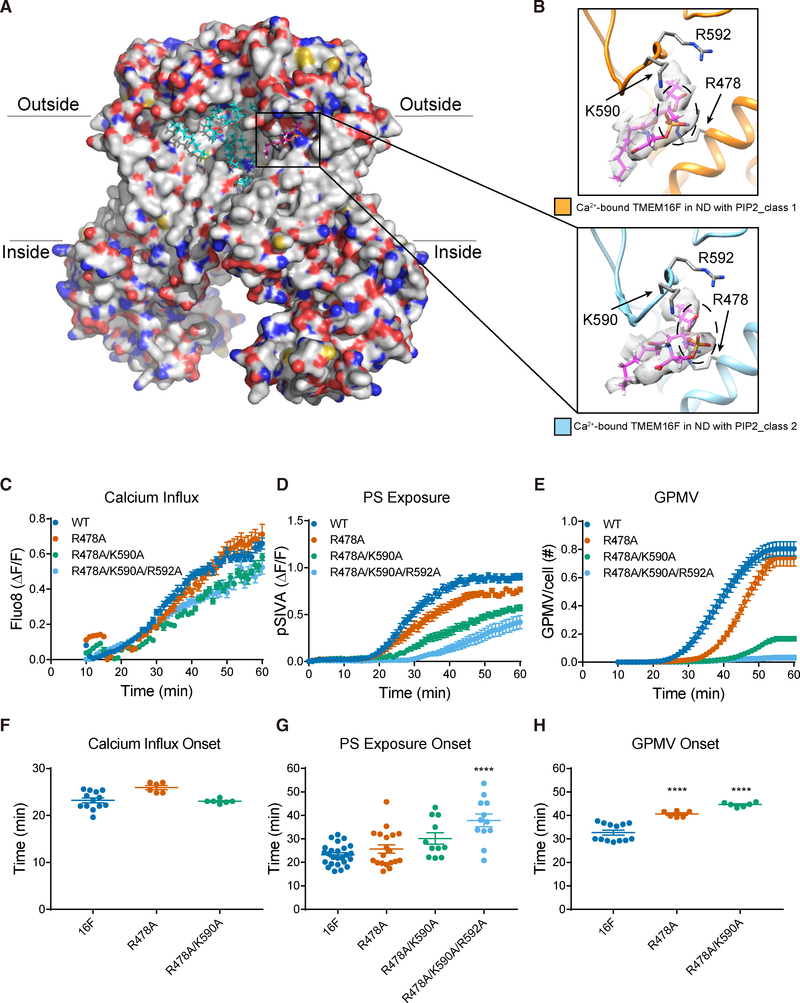
Figure 5. PIP2-Dependent Lipid Binding Near Membrane Distortion and Functional Tests of Lipid-Binding Residues.
(A) Ca2+-bound TMEM16F (class 2) in PIP2 supplemented nanodiscs. Bound lipids are in cyan, and the one shown in (B) is in magenta.
(B) A phosphatidylserine (PS) (fatty acid tails in magenta and headgroup encircled with dashed line, superimposed on the sharpened electron density map in light gray) has its polar headgroup coordinated by R478 on TM3 and K590 and R592 on the TM5-TM6 loop. TMEM16Fs from class 1 (in orange, top panel) and class 2 (in blue, bottom panel) are shown with the same protein orientation.
(C–E) Live imaging of TMEM16F-dependent Ca2+ influx (C), PS exposure (D), and GPMV generation (E). Time-lapse imaging of 500–1,000 cells with 10× magnification was performed to concurrently monitor GPMV formation and Ca2+ influx via Fluo-8 fluorescence. Time-lapse imaging of individual cells viewed with 603 magnification was performed to monitor PS exposure via pSIVA fluorescence. Data are represented as mean ± SEM.
(F–H) Scattered dot plots of time of onset of TMEM16F-dependent Ca2+ influx (F), PS exposure (G), and GPMV generation (H). Time of onset could not be determined for those time courses with a linear rather than sigmoidal rise. Data are represented as mean ± SD. *p < 0.05; **p < 0.01; ***p < 0.001; ****p < 0.0001. Statistical significance of all mutants as compared to TMEM16F WT is determined by one-way ANOVA followed by Holm- Šídák multiple comparisons test.

