
Figure 6.
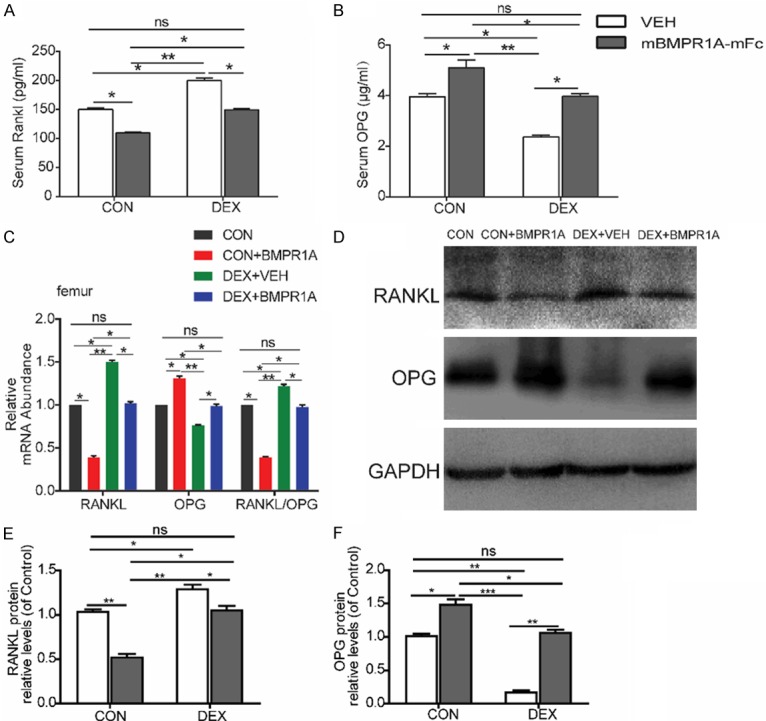
mBMPR1A-mFc treatment alters RANKL/OPG signaling. A, B. Serum Rankl and OPG were measured by ELISA. C. qPCR analysis of mRNA expression of of RANKL, OPG, and RANKL/OPG ratio in femurs. D. Protein expression of RANKL and OPG in each group, as assessed by Western blot analysis. E, F. Densitometry results of RANKL and OPG protein expression in each group. Values are expressed as mean ± SD, n=10 per group. ns, not statistically significant; *, P<0.05; **, P<0.01; ***, P<0.001, versus the indicated group.