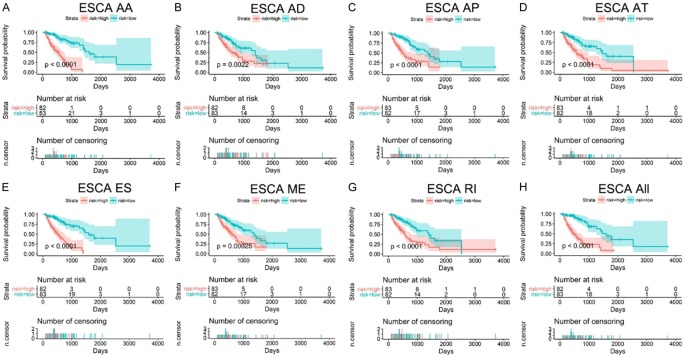
Figure 6.
Prognostic models of AS events for ESCA patients. The top part of each drawing displays the survival curve of ESCA patients. Blue curves represent the low-risk group, while red curves represent the high-risk group. The middle part displays the number of high/low-risk patients at a certain time point, while the bottom part displays the relationship between the number of censoring and time. A-H. Kaplan-Meier curves of prognostic models were built with AA, AD, AP, AT ES, ME, RI, and seven combined events in ESCA.

