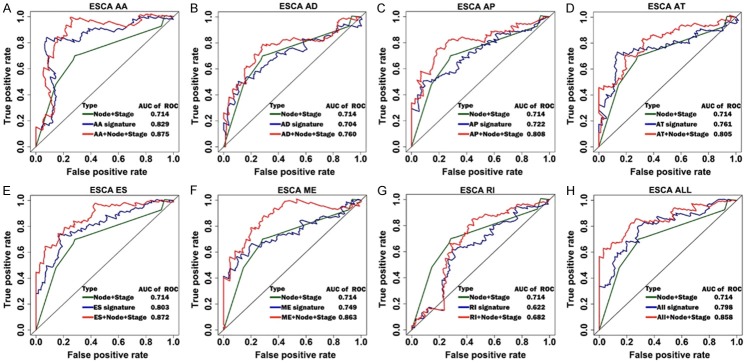
Figure 7.
ROC curves for comparing prognostic models of independent AS events, independent clinical parameters, and the combination of both in ESCA. The horizontal axis represents false positive rate, while the vertical axis represents true positive rate. A-H. ROC curves of combined prognostic signatures were built with clinical parameters and each type of AS events in ESCA.

