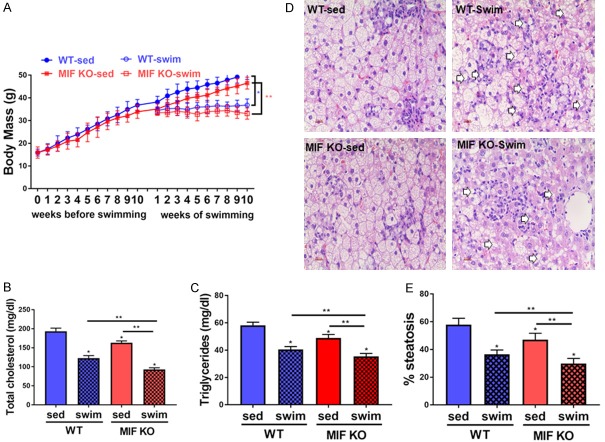
Figure 1.
Biometry and lipid metabolism. A. Body mass evolution. High fat diets were administered for 20 weeks and swim training for 10 weeks (n=10 for each group; *P < 0.05 between WT sed and WT swim, **P < 0.05 between MIF KO sed and MIF KO swim). B and C. Total cholesterol and triglycerides (mg/dl) in all those groups (n=10 for each group; *P < 0.05 vs. WT sed, **P < 0.05 vs. MIF KO swim). D and E. Volume density hepatic steatosis. Values are means ± standard error of the mean (n=10 for each group; *P < 0.05 vs. WT sed, **P < 0.05 vs. MIF KO swim). WT sed, Wild type sedentary group; WT swim, wild type swim training group; MIF KO sed, MIF KO sedentary group; MIF KO swim, MIF KO swim training group.

