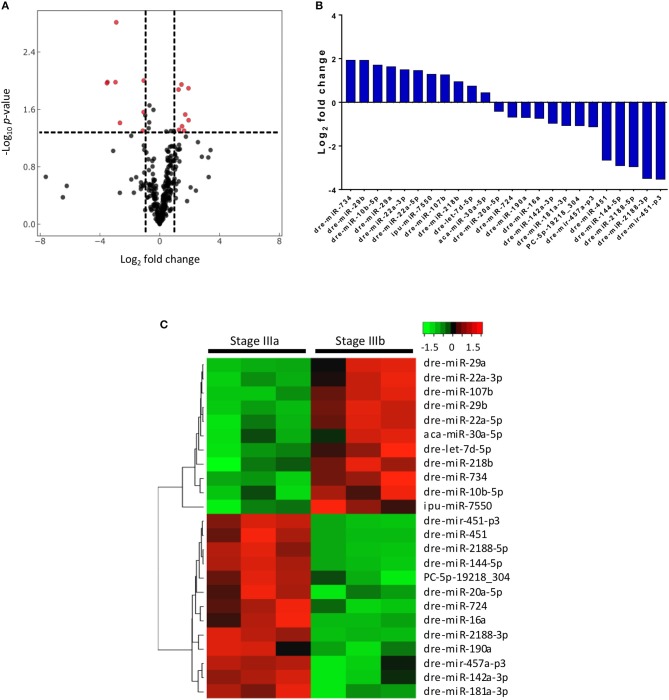
Figure 2.
Differential expression of 24 miRNAs in stage IIIa and IIIb follicular cells. (A) Volcano plot of miRNAs expressed in stage IIIb vs. stage IIIa follicular cells. Vertical lines indicate fold change <1/2 and >2 and the horizontal line represents the threshold of significant change (p ≤ 0.05). (B) Relative mean expression of the miRNAs (log2 fold change) in stage IIIb follicular cells compared to stage IIIa cells (P-value ≤0.05). (C) Heatmap of differentially expressed miRNAs between stage IIIa and IIIb follicular cells.

