
Figure 3.
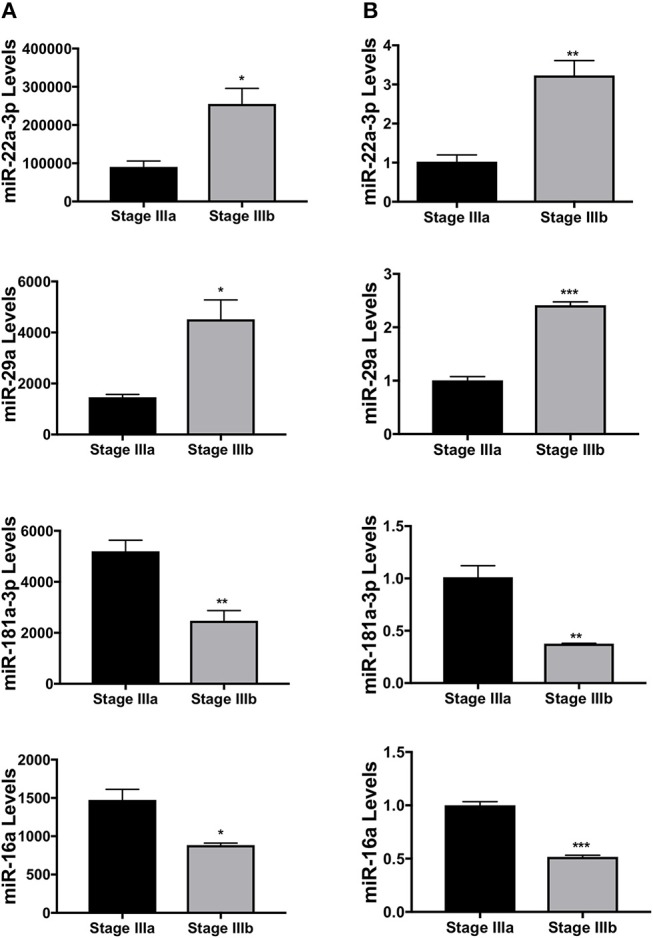
Validation of several miRNAs differentially expressed between stage IIIa and IIIb follicular cells. (A) miRNA expression levels of dre-miR-22a-3p, dre-miR-29a, dre-miR-181a-3p, and dre-miR-16a detected by the small RNA-seq. (B) Relative expression levels of the same miRNAs measured by real-time PCR. Data represent mean ± SEM (n = 3). *P ≤ 0.05; **P < 0.01; ***P < 0.001 as analyzed by Student's t-test.