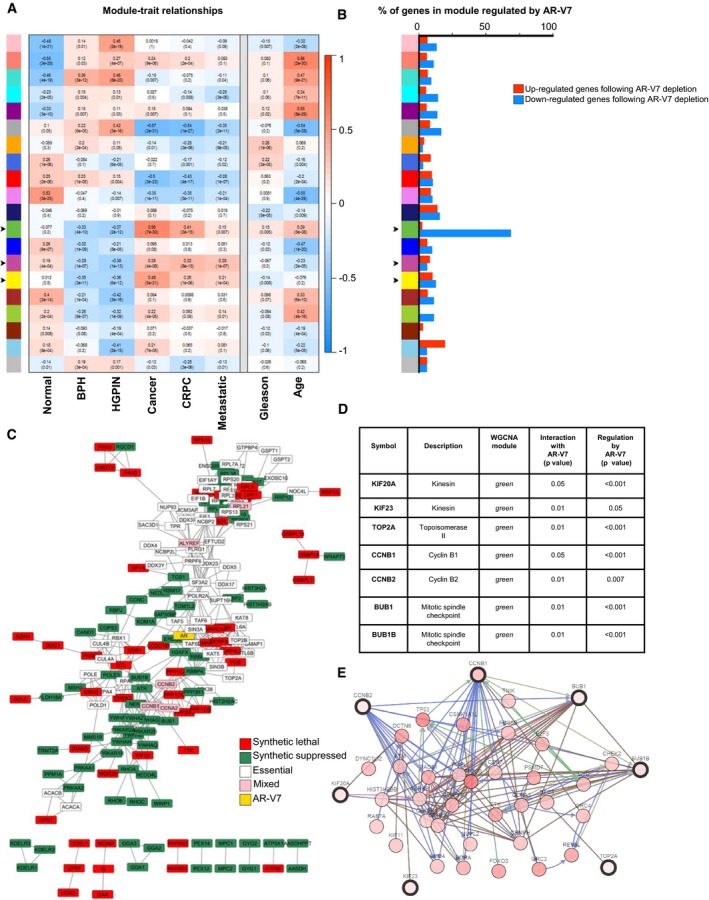
Figure 1. Multifaceted system‐level analyses identify seven prostate cancer hub genes.

- Module–trait relationships were established by WGCNA using eight independent microarray analyses comprising 375 human prostate samples. Gene modules (y‐axis) are denoted by an arbitrary color name. Bins show the Pearson correlation value between gene expression levels of each module within the noted phenotype/disease stage (x‐axis) and P‐values. A value of 1 (red) quantifies the strongest positive correlation (genes are upregulated), −1 (blue) the strongest negative correlation (genes are downregulated), and 0 (white) no correlation. Arrows indicate those modules whose genes were positively associated with PC.
- Microarray analysis was performed following doxycycline‐regulated specific AR‐V7 depletion (using a tet‐pLKO backbone) in 22Rv1 PC cells compared to doxycycline‐treated shGFP controls. The genes that were significantly regulated by shAR‐V7 (in either direction, P‐value < 0.05) were distributed among the gene modules defined by WGCNA in panel (A). Upregulated genes (red) are those in which expression increased following AR‐V7 depletion, and conversely, downregulated genes (blue) are those that decreased following AR‐V7 depletion. Arrows indicate those modules whose genes were positively associated with PC.
- AR‐V7 human functional interactome was generated using SGA screening in the yeast Schizosaccharomyces pombe, combined with STRING data to map protein–protein interactions, followed by the identification of the human orthologs. The colors denote the different types of genetic interactions: Red are genes that when deleted in yeast and crossed with AR‐V7‐expressing yeast suppressed growth, while green denotes genes that when deleted enhanced growth. White designates yeast essential genes (i.e., genes that are critical for yeast survival and thus could not be present in the yeast deletion library), but were incorporated into the network based on the criteria that they are known (based on literature) to physically interact with at least two of the red or green genes. Pink‐colored genes are a combination of essential and non‐essential genes identifying the same human protein.
- Table summarizing the seven PC hub genes identified by the system‐level analyses.
- Network interactions of the seven genes with the 50 most frequently altered neighbor genes were mapped using cbioportal.org. The types of gene‐to‐gene interactions are as follows: controls state change (blue), controls expression (green), and in complex with (brown).
Source data are available online for this figure.
