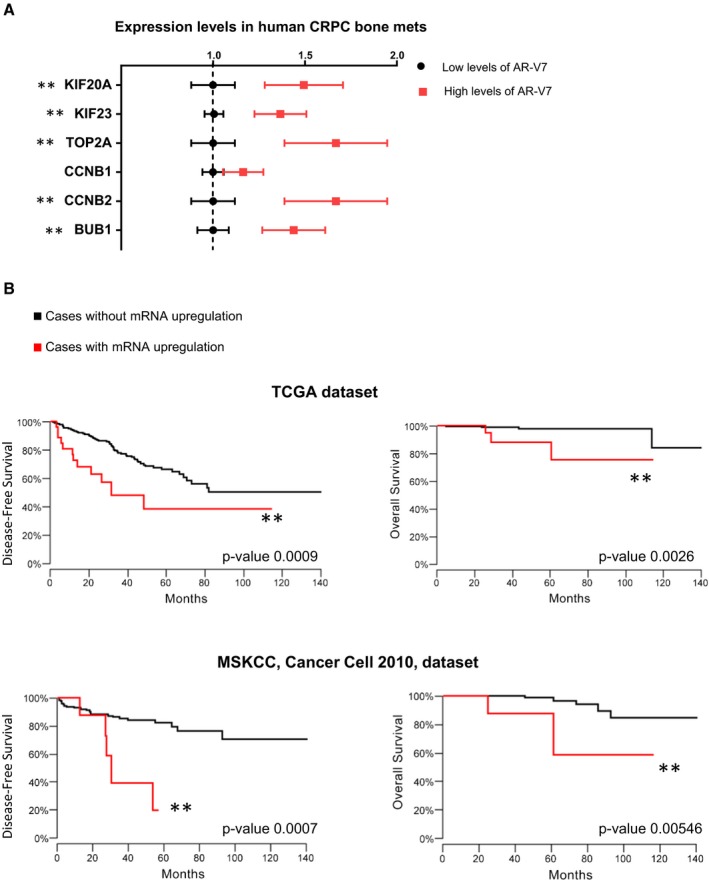
Figure 2. Elevated expression of the seven‐gene set is associated with higher levels of AR‐V7 and serves as a prognostic biomarker for disease‐free survival (DFS) and chances of death in PC patients.

- Hörnberg et al (2011) gene expression profiling array data were analyzed to determine the expression levels of the seven genes in human CRPC bone metastases, grouped by their relative levels of AR variants, mainly AR‐V7 [high levels of AR‐V7 (top quartile) or low levels of AR‐V7 (quartiles 1–3)]. Data are plotted as the mean ± s.e.m. Non‐parametric Mann–Whitney test was performed (two‐tailed). Note that BUB1B expression was not measured in these microarrays. **P‐value < 0.05. N (AR‐V7 low) = 20; N (AR‐V7 high) = 10.
- The Kaplan–Meier curves for disease‐free survival (DFS) and overall survival were built using the TCGA Prostate Adenocarcinoma dataset (465 samples; upper graphs). Log rank tests were performed. The black curves denote cases with normal expression of the gene set, and red represents cases where the mRNA levels of the seven genes were upregulated (z‐score threshold ≤ 1.96). For DFS, P‐value = 0.0009; for death, P‐value = 0.0026. An independent dataset was analyzed (Prostate Adenocarcinoma MSKCC, Cancer Cell 2010, 123 samples; lower graphs). The black curves denote cases with normal expression of the gene set, and red represents cases where the mRNA levels of at least five genes of the gene set were upregulated (z‐score threshold ≤ 1.96). For DFS, P‐value = 0.0007; for death, P‐value = 0.00546.
