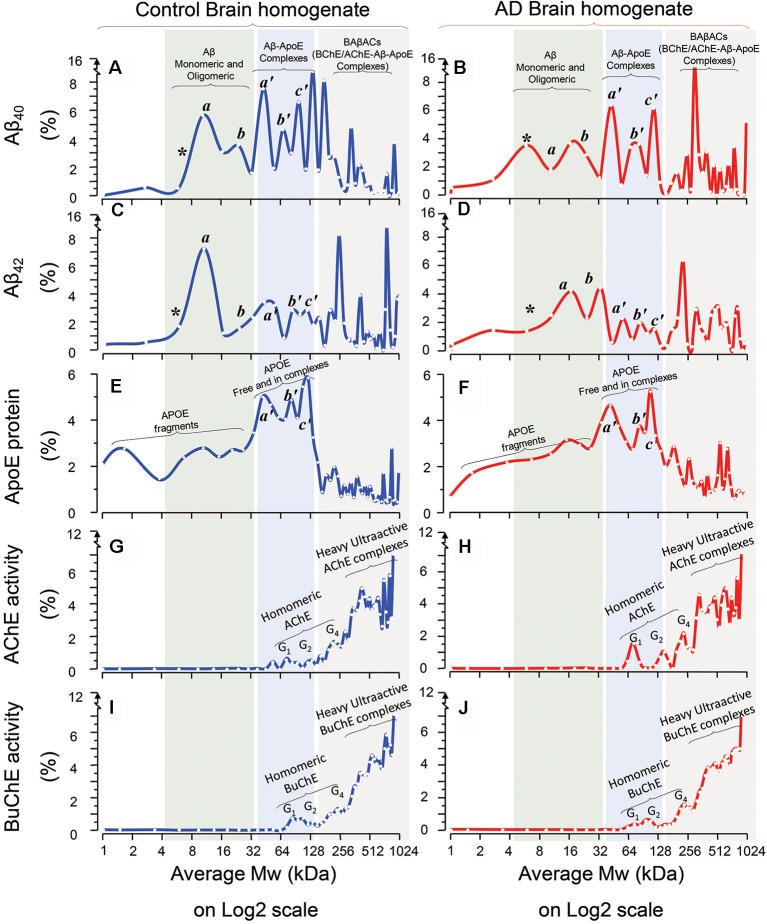
Figure 1.
Homomeric and heteromeric forms of Amyloid-beta (Aβ), Apolipoprotein-E (ApoE) and cholinesterases in Alzheimer’s Disease (AD) and non-demented post-mortem brain. Sucrose density gradient (SDG) and ultracentrifugation were used to separate the protein content in the brain homogenates (BH) from a group of AD (n = 6) and non-demented controls (n = 6), from three different brain regions, medial frontal gyrus (MFG) and/or superior temporal gyrus (STG) and/or superior parietal gyrus (SPG). Following o/n ultracentrifugation, the content of each SDG tube was fractionated into ~50 equal fractions from the bottom of the tubes, and the levels of Aβ1–40, Aβ1–42, and ApoE proteins, as well as of Acetylcholinesterase (AChE) and Butyrylcholinesterase (BuChE) activities were measured in all fractions, as further described in the “Materials and Methods” section. The y-axis in the SDG spectra indicates the protein level or activity level corresponding to each SDG fraction, represented as % of the total level of that protein in the SDG gradient. The x-axis shows the log2 scale of estimated molecular weight (Mw) corresponding to each fraction content. Each spectrum is composed of aggregated data from the three examined brain regions. (A–D) The relative levels of Aβ1–40 (A,B) and Aβ1–42 (C,D) peptides in the fractions are plotted vs. the corresponding molecular weights (Mw) of the fractions. The peaks indicated as *, a, and b exhibit Mw values that closely correspond to the molecular weight of Aβ monomers (~4 kDa), dimers (~8 kDa) and tetramers or hexamers (~16–24 kDa) respectively (light green shaded areas). The peaks indicated as a’, b’, and c’ exhibit Mw values that closely correspond to the molecular weight of ApoE monomers (~34 kDa), dimers (~68 kDa) and ApoE complexes (~128 kDa) respectively, which indicates that Aβ peptides were incorporated into stable Aβ-ApoE complexes (the light blue shaded areas). This is confirmed in (E,F), where the levels of ApoE protein are plotted against the Mw values of the fractions. The peaks a’, and b’ exhibit Mw values that closely correspond to the molecular weight of ApoE monomers (~34 kDa) and dimers (~68 kDa) respectively, whereas peak c’ (~128 kDa) indicates heavy ApoE complexes with Aβ (light blue shaded areas). In other words, both ApoE and Aβ SDG spectra indicate that Aβ and ApoE co-sediment and thereby form complexes in the human brain (extracts). (G–J) The relative levels of AChE (G,H) and BuChE (I,J) enzymatic activities in the SDG fractions are plotted against the Mw values of the fractions. The activity peaks indicated as G1, G2 and G4 exhibit Mw values that closely correspond to the expected molecular weight of the monomeric, dimeric and tetrameric globular forms of AChE and BuChE (~55–70, 110, 250 kDa and 75, 150, 280 kDa, respectively). Nonetheless, the most activity-intense peaks show much heavier Mw than the Mw expected for G4 AChE and/or BuChE. A comparison of these heaviest peaks in the SDG spectra among all the panels (gray shaded areas in A–J) clearly indicate that these heavy AChE/BuChE molecules co-sediment with certain heavy peaks that contain both Aβ (A-D) and ApoE (E,F). Thus, the presence of activity-intense AChE and BuChE peaks at higher Mw fractions (>250 kDa, gray shaded areas) indicates formation of heteromeric complexes of hyperactivated forms of cholinesterases. The presence of high-Mw peaks of Aβ and ApoE in these same areas (graphs A–F; gray shaded areas) supports the notion of formation of BAβAC (BuChE/AChE-Aβ-ApoE) complexes in both AD and control brain extracts. Note that there are combinations of technical and mathematical issues that make the use of error bars in the classical meanings inapplicable in an SDG spectrum. This instead is appreciated by considering both the height and width of the peaks in each SDG spectrum, e.g., a comparison between the heights of individual peaks should be avoided unless their width are reasonably similar.

