Figure 2.
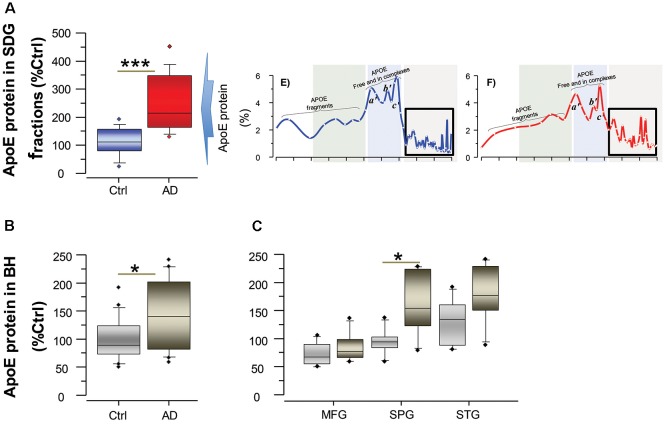
ApoE levels are higher in the brain of AD than controls. ApoE levels were quantified by ELISA both in the SDG fractions (A) and in unfractionated brain homogenates (B) from the same AD subjects (n = 6) and non-demented controls (n = 6). Post-mortem brain MFG, STG and SPG regions were used for the measurements. The ApoE levels are presented as percentage of the control brain ApoE. (A) Total ApoE protein levels in the SDG fractions (in the three analyzed brain regions), calculated as sum of the ApoE levels in all fractions with Mw >200 kDa, as indicated by the boxed area in the inset SDG spectra from Figures 1E,F; and shown as average of the three analyzed brain regions. (B,C) Total ApoE protein levels in unfractionated brain homogenates, shown as average of the three analyzed brain regions (B) and in each region separately (C). Student’s t-test ***p < 0.001, *p < 0.05.

