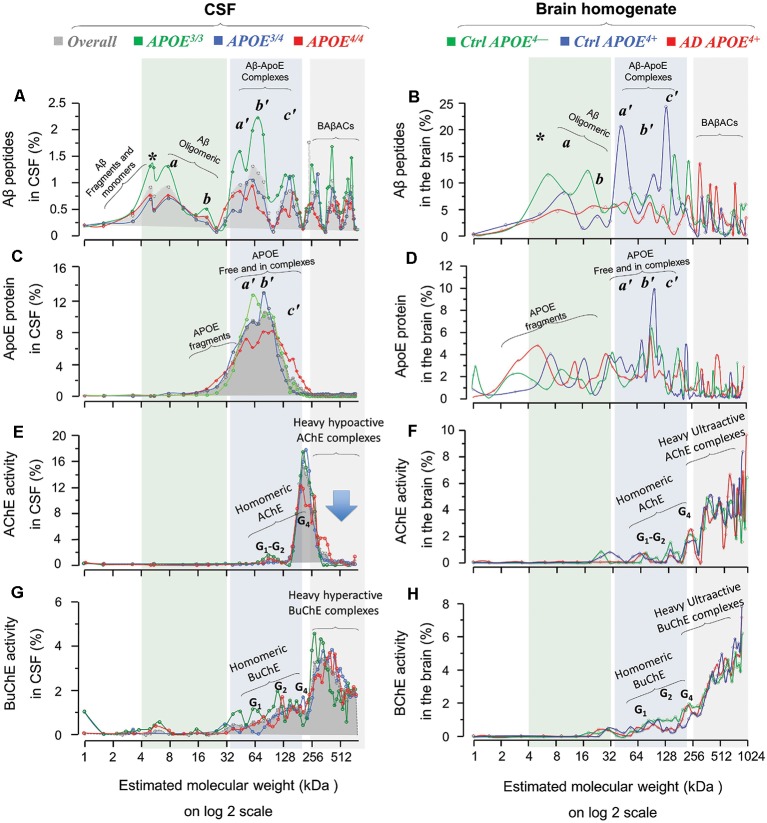
Figure 4.
Homomeric and heteromeric forms of Aβ, ApoE, cholinesterases and their complexes in post-mortem brain and cerebrospinal fluid (CSF) in relation to APOE genotype. SDG and ultracentrifugation were used to separate the protein content of nine distinct pooled CSF samples, prepared from ~170 AD subjects with known APOE genotype (3/3, green diagrams; 3/4, blue diagrams; or 4/4, red diagrams; in the spectra panels A,C,E and G). Similar analyses were done on the brain homogenates from a group of AD (n = 6) and non-demented controls (n = 6), from three different brain regions, MFG and/or STG and/or SPG. Following o/n ultracentrifugation, the content of each SDG tube was fractionated into ~50 equal fractions from the bottom of the tubes, and the levels of Aβ1–40, Aβ1–42, and ApoE proteins, as well as of AChE and BuChE activities were measured in all fractions, as further described in the “Materials and Methods” section. The y-axis in all SDG spectra indicates the % of protein or activity level in each SDG fraction relative to the total level of that protein in the whole SDG gradient. The x-axis shows the log2 transformation of the estimated molecular weight (Mw) for each fraction. The light green shaded area represents low molecular weight fractions, corresponding to Mw of 4–32 kDa, the light blue shaded area corresponds to Mw of 32 to ~200 kDa, and the light gray shaded area corresponds to Mw ranges between 250 kDa and 1024 kDa. The SDG spectra in (A) depict various Aβ-containing peaks separated by SDG ultracentrifugation of pooled AD CSF samples, with color-coded indication of the APOE genotype. Panel (B) shows Aβ-peaks in the AD and control brain extract samples, with color-coded APOE genotype and disease status indication. Comparison of SDG spectra in the light-green shaded area of (A,B) reveals essentially similar peak pattern corresponding to Aβ monomers and homomeric Aβ complexes that are detected in both CSF and brain. Peaks marked with * represent Aβ monomers, whereas the peaks a and b correspond to Mw of 8 and ~16 kDa, and may hence represent the homomeric dimers and tetramers of Aβ, respectively. Panels (C,D) show the corresponding SDG spectra for ApoE-containing peaks in CSF and brain extracts, respectively. The peaks a’, b’and c’ in the light blue shaded area (Mw range of 32–200 kDa) correspond to both free ApoE protein as well as heteromeric Aβ-ApoE complexes. This is readily appreciated from a comparison between (A,C) and between (B,D) which confirms the co-sedimentation of Aβ and ApoE in the a’, b’ and c’ Aβ-ApoE triple peaks. Nonetheless, these triple peaks in (C) or (D) are broad (or less distinct), indicating that a portion of the peaks most likely represents fragments and free monomeric or dimeric ApoE proteins, with an expected size of ~30, 34 and 68 kD. The peak c’ however exhibits a Mw >128 kD, which is clearly too heavy to consist only of ApoE. The SDG spectra in (E,F) illustrate the peaks of various globular molecular forms (G1, G2 and G4) of AChE separated based on their relative activity in the SDG fractions of the CSF and brain extracts, respectively. These peaks are accompanied by much heavier AChE-activity peaks (>300 kDa) in both the CSF and the brain SDG spectra. The SDG spectra in (G,H) show the corresponding findings for the various BuChE molecular forms (G1, G2 and G4) as well as the heavier (~300–1024 kDa) hyperactive peaks. It should be noted that these heavy AChE and BuChE peaks also exhibit co-sedimentation with the heavy Aβ-peaks (as can be seen in A,B), providing evidence for formation of BAβACs in the SDG fractions of both the CSF and brain extracts. However, a major difference is detectable in this region for CSF vs. the brain spectra, particularly in case of the heavy AChE-containing peaks: namely they are relatively hypoactive in CSF (denoted by the arrow in E) but are ultra-active in the brain SDG spectra. A more thorough mechanistic explanation for this difference is given in the “Discussion” section, but it should be briefly noted here that this is most likely caused by a prolonged exposure/interaction between Aβ and AChE in CSF which leads to inhibition of AChE (but not BuChE).

