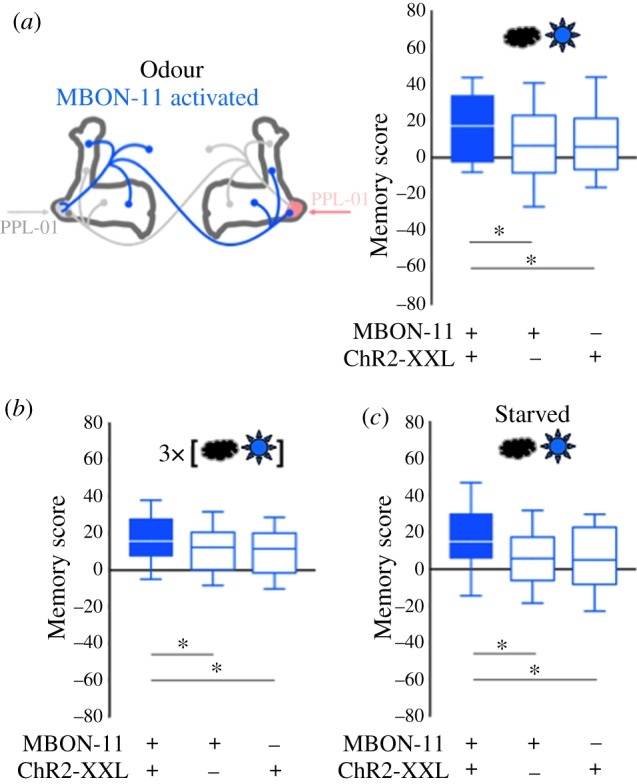
Figure 2.

(a,b) The same as in figure 1b, c but using ChR2-XXL to activate MBON-11 (star). This leads to stronger appetitive learning in the experimental genotype than in genetic controls. (c) Same as the experiment in (a), but with an initial 18 h period of wet starvation, which improves appetitive learning [24]. Underlying preference scores can be found in electronic supplementary material, figure S3. Sample sizes and statistical results can be found in electronic supplementary material, table S1. Other details as in the legend of figure 1. (Online version in colour.)
