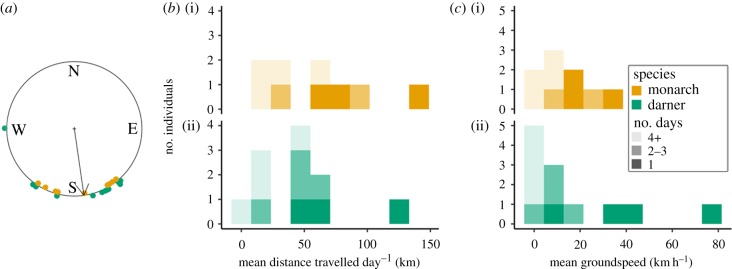
Figure 2.
(a) Circular plot displaying the direction of movements between detections. Arrow shows the circular mean direction. (b) Histograms displaying the estimated mean distance of travel each day between detections and (c) the estimated mean groundspeed of travel between detections for radio-tagged monarchs (i) and common green darners (ii). Dark bars indicate distances and speeds calculated from detections between two towers within the same day, whereas lighter bars indicate calculations from detections between multiple (2–3 or 4+) days.

