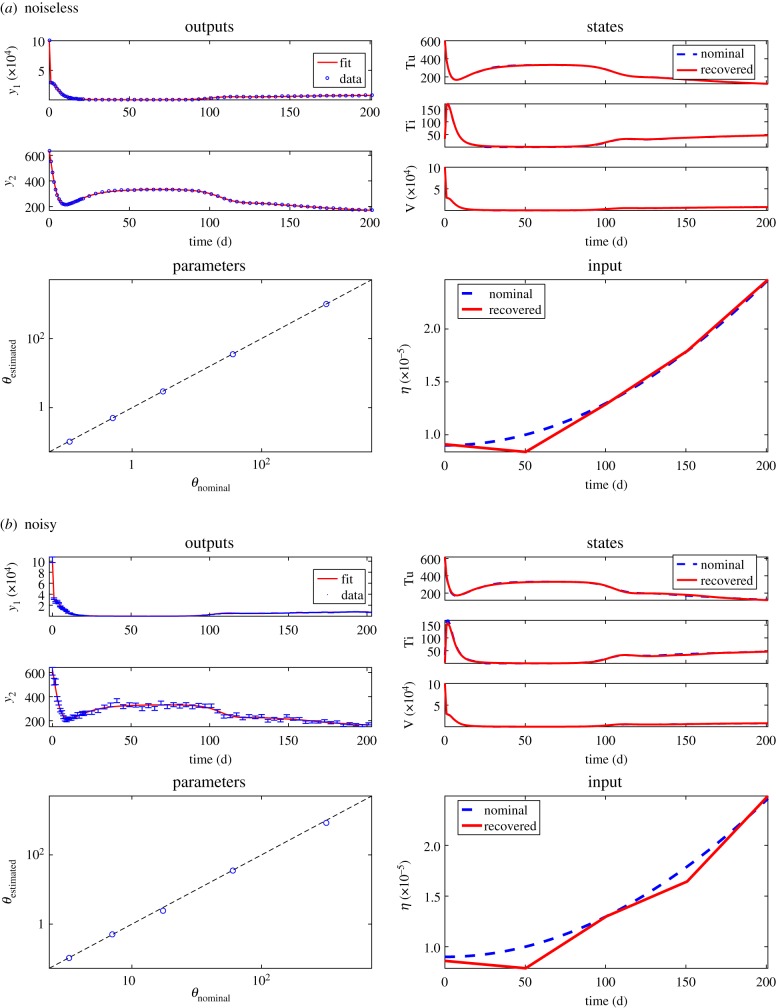
Figure 4.
Case study HIV: results of the full system reconstruction for the noiseless (a) and noisy (b) estimations. In both noiseless and noisy cases the upper left subplots show the fit of the model output to time-series synthetic data. The remaining subplots show the estimated states, parameters and inputs. (Online version in colour.)

