
Figure 2.
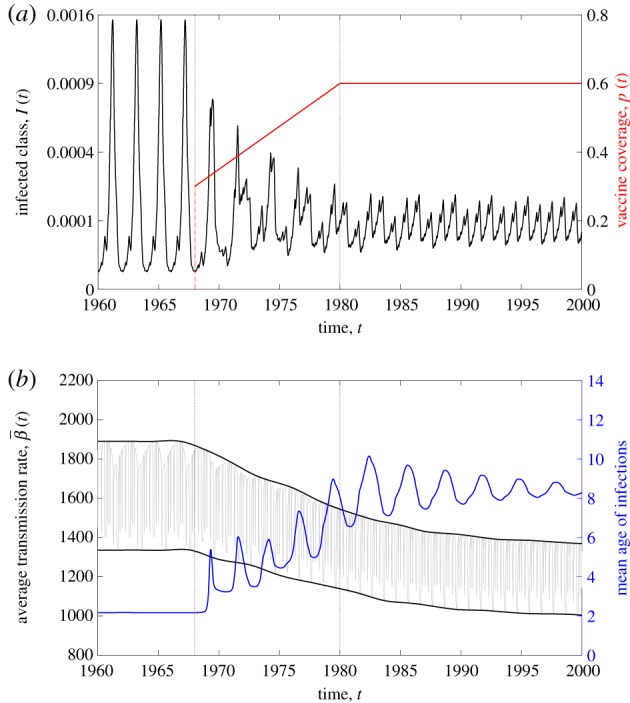
Dynamics of a model with two age classes (M = 2) after vaccination with , , , ν1 = (1/12) yr−1 and . The younger age class N1 is assumed to have higher and seasonal contact rates due to school-term forcing, β1,1(t) = bT(t) where T(t) is the term-time forcing function [9]. The older age class N2 is assumed to have contact rates given by β2,2 = β1,2 = β2,1 = (1/2)b where . Refer to electronic supplementary material, S1 for further details on how these parameter values were chosen. (a) The aggregate prevalence (black) in a model with two age classes changes with vaccine uptake (red). A biennial cycle of epidemics is observed during the pre-vaccine era. The asymptotic dynamics in the vaccine era are annual. (b) The average transmission rate (black), its mean value and its amplitude of oscillation decreases with the increasing vaccine uptake given in (a). The mean age of the infected class (blue) increases with increasing vaccine uptake. (Online version in colour.)