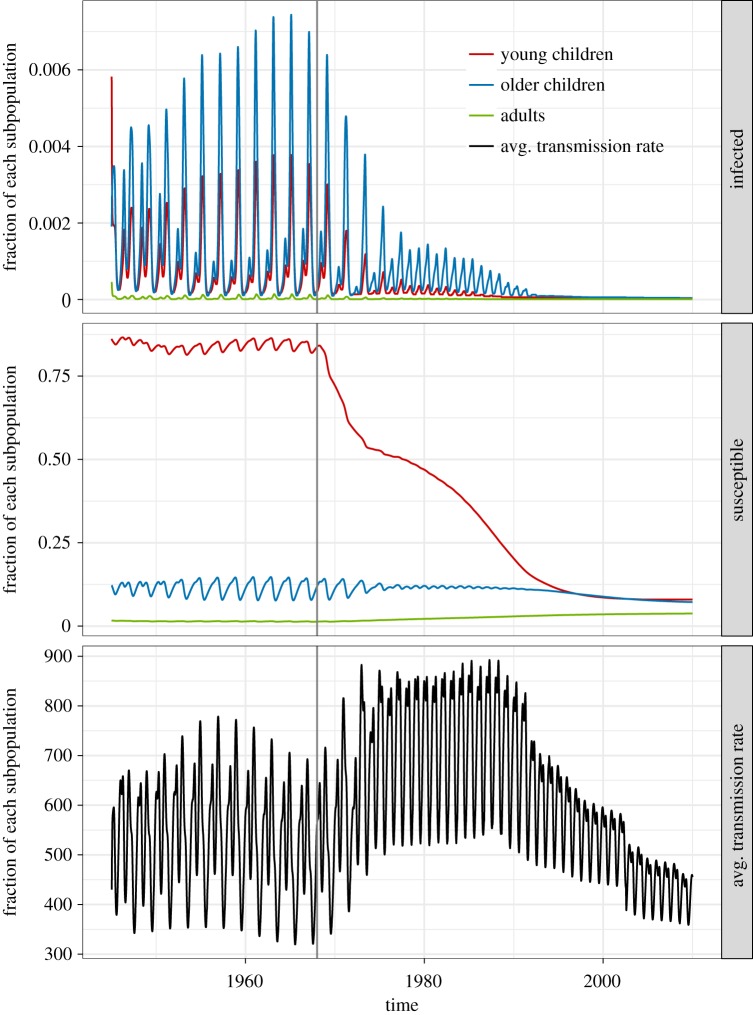
Figure 9.
The infected fraction, susceptible fraction and average transmission rate over time of the age-structured model at its maximum-likelihood parameter values when fitted to the 1945–1990 data and simulated from 1945 to 2020. The infected and susceptible fractions of each of the three age classes are plotted. The average transmission rate changes over time as the age distributions of the infected and susceptible classes change (refer also to figure 10). Similar to figure 2b, has a high magnitude and amplitude of oscillation in the pre-vaccine era which is eventually replaced by a lower magnitude and amplitude in the late vaccine era. In the transition period, we actually observe a temporary increase in the magnitude of which we do not see in figure 2b. (Online version in colour.)

