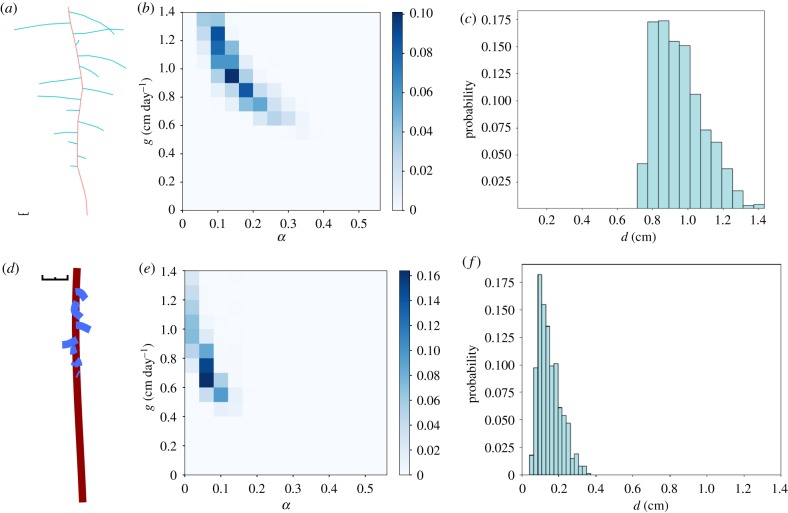
Figure 2.
Posterior distributions on Arabidopsis thaliana and Lupinus angustifolius roots generated using RootBox. (a) Output from RootBox simulation of Lupinus angustifolius root growth; black scale bar is 1 cm. (b,c) Output posteriors from an ABC SMC framework run on RootBox output of Lupinus angustifolius, with final ABC SMC tolerance ε = 0.4 (Material and methods). (b) Two-dimensional posterior on primary root growth rate g and lateral root growth scaling α. (c) Posterior distribution on branch separation d in the RootBox growth model. (d) Output from RootBox simulation of Arabidopsis thaliana root growth; black scale bar is 1 cm. (e,f) Output posteriors from an ABC SMC framework run on RootBox output of Arabidopsis thaliana, with final ABC SMC tolerance ε = 0.4 (Material and methods). (e) Two-dimensional posterior on primary root growth rate g and lateral root growth scaling α. (f) Posterior distribution on branch separation d in the RootBox growth model. (Online version in colour.)

