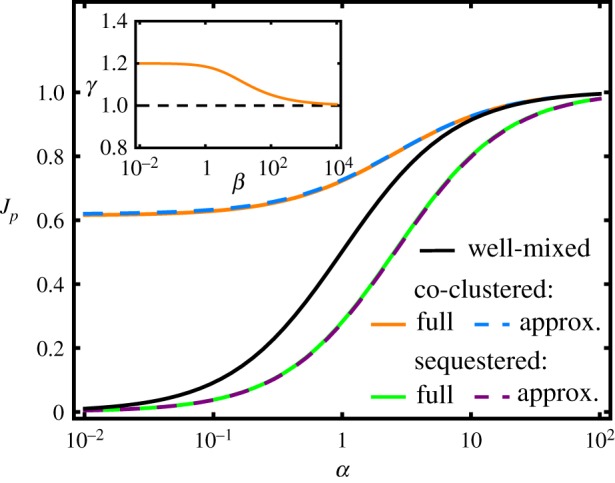
Figure 2.

Branching fraction Jp as a function of the enzyme activity ratio α for the enzyme sequestration strategy (green solid curve), the enzyme co-clustering strategy (orange solid curve) and for a well-mixed system of uniformly distributed enzymes (black curve). The dashed lines show the corresponding approximative forms in the limit [EP]/cc,s ≪ 1, equation (2.7). The parameter values are kp = kq = 105 M−1 s−1, cc,s = 25 mM, rc = rs = 0.4 μm, and D = 100 μm2 s−1. (Inset) The behaviour of the dimensionless function γ(β), introduced in equation (2.7) and defined in equation (2.9). (Online version in colour.)
