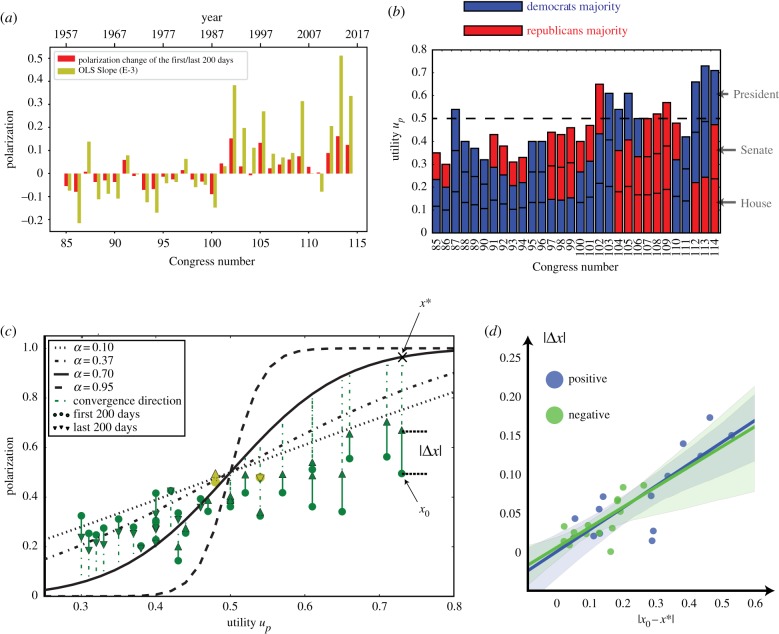
Figure 3.
The evolution of the political polarization in the US Congress with subsequent sessions numbered from 85 to 114. (a) Change of polarization within each US Congress based on data and the optimal slope parameters estimated by the Ordinary Least Squares (OLS) linear regression given the 10 evenly distributed in time points of polarization sampling for each Congress. The polarization level is likely to decrease within each Congress after the member replacement in the 1970s and 1980s. However, after the 101th Congress, which started in 1989, the polarization level is likely to increase instead; (b) the estimated values of the polarization utility up are generally increasing, while the periods of sharp growth are often associated with the change of majorities in the Senate and the House of Representatives; (c) when the initial polarization level (dark circles) is smaller than the stable polarization level predicted by our model (solid black curve), we observe an increase of polarization within the corresponding Congress. The direction of such change in 28 out of all 30 Congresses are explained by the model (dark arrows), while the two Congresses in disagreement with prediction have minimal variations of the polarization level (light arrow markers) which indicates weakly formed polarization direction; (d) when the initial polarization level x0 of a Congress is farther away from the corresponding equilibrium point, the absolute change of polarization during the two-year term, i.e. |Δx|, of this Congress is usually higher than of Congresses in which the initial polarization levels are closer to the equilibrium points. The colour of the scatter points indicates the sign of Δx. (Online version in colour.)

