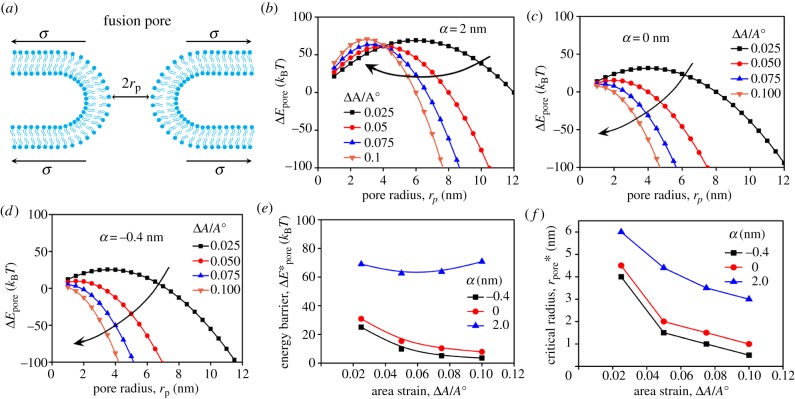
Figure 5.
The energy barrier for fusion pore formation depends on the local area strain as well as the local tension characterized by α. (a) Schematic diagram of a fusion pore under tension. The energy barrier changes with the pore radius at different area strains for α = 2 nm (b), 0 nm (c) and −0.4 nm (d). The energy barrier and critical radius for the cases in (b–d) are plotted in (e) and (f), respectively. For curves in panels (b–d), λ0 = 10 pN and Kmem = 100 nN µm−1. (Online version in colour.)

