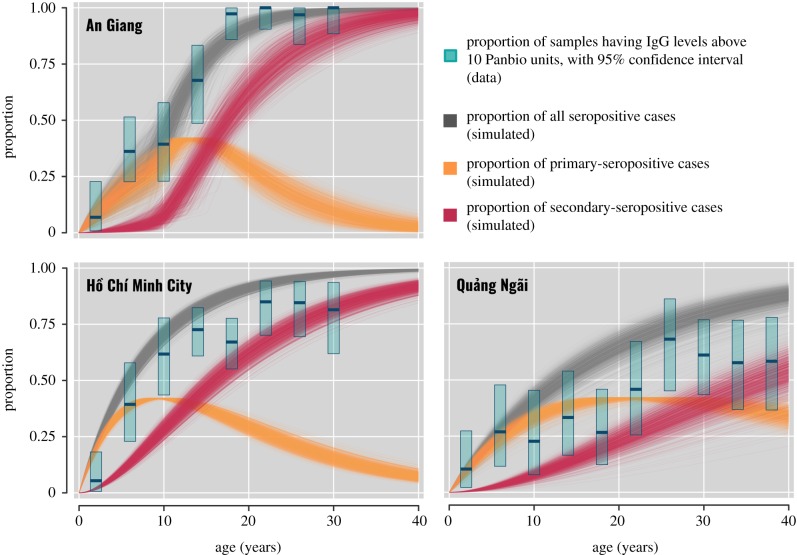
Figure 2.
The seroprevalence of dengue in the study populations. The bars represent the proportion (with 95% confidence intervals) of samples in each age group of 4 years that have IgG levels above 10 Panbio units. The lines show the estimates of seroprevalence from 1000 simulations, of which the parameters were drawn from the posteriors of the following models: AgiCon33 (for An Giang), HcmCon31 (for Ho Chi Minh City) and QngCon31 (for Quang Ngai). (Online version in colour.)

