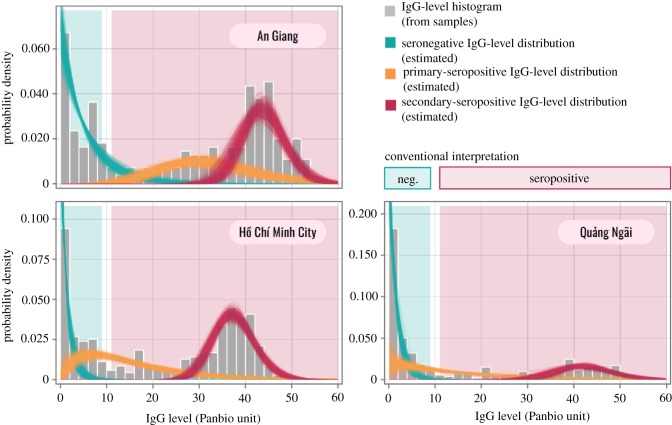
Figure 3.
The histogram of the measured IgG levels (bars) and the inferred IgG-level distributions (lines) of the three exposure classes (seronegative, primary seropositive and secondary seropositive) across the study populations. The IgG-level distributions were simulated 1000 times based on the posteriors of the following models: AgiCon33 (for An Giang), HcmCon31 (for Ho Chi Minh City) and QngCon31 (for Quang Ngai). (Online version in colour.)

