Figure 3.

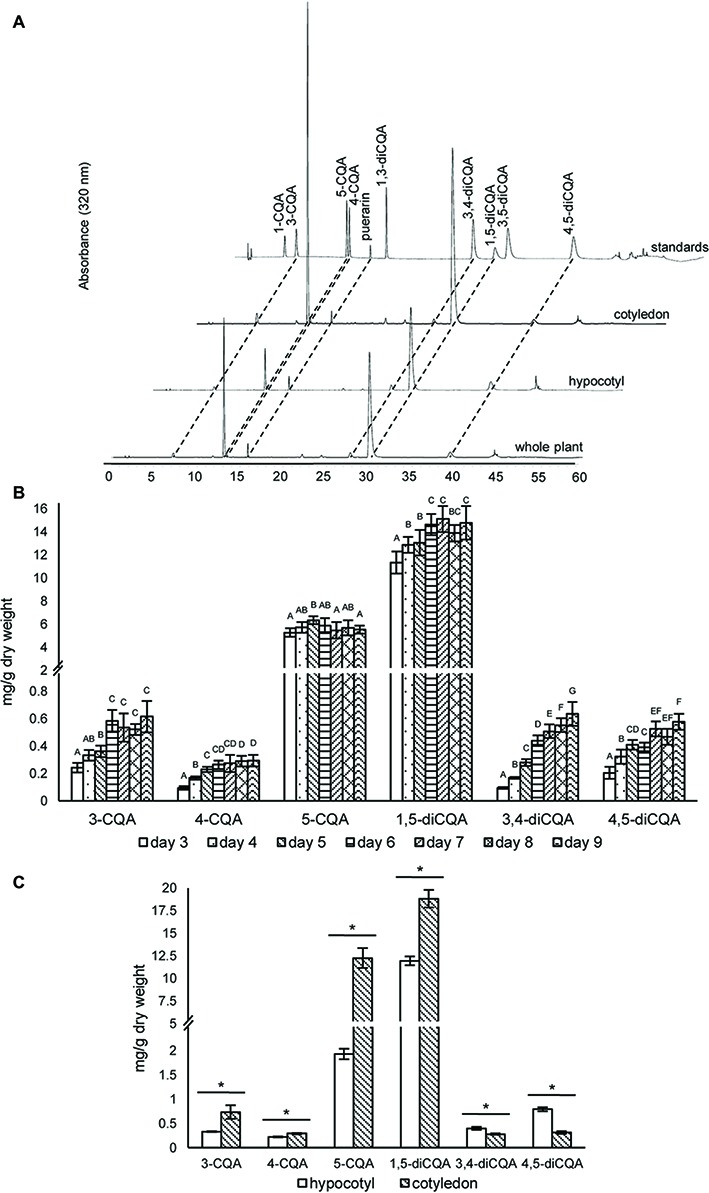
HPLC profiles and concentrations of caffeoylquinic acids in sunflower sprout extracts from different time points during germination and from different tissues. HPLC chromatograms of caffeoylquinic acids of sunflower extracts from whole sprout, hypocotyl, and cotyledon, using puerarin as an internal standard (A); extracts of sunflower sprouts sampled at different time points (days 3–9) during the germination period were measured by HPLC; comparisons are shown for different time points within each caffeoylquinic acid derivative. Bars represent the mean values ± standard deviation (SD) of five biological and independent replicates; for each derivative, different alphabets indicate significant differences according to Duncan’s multiple-range test (p < 0.05) (B); and tissue specific concentrations of caffeoylquinic acid derivatives measured in the hypocotyls and cotyledons of sunflower sprouts sampled at 5 day post-germination; an asterisk (∗) above the bars indicates a significant difference between the two tissues (Student’s t test, p < 0.05) (C).
