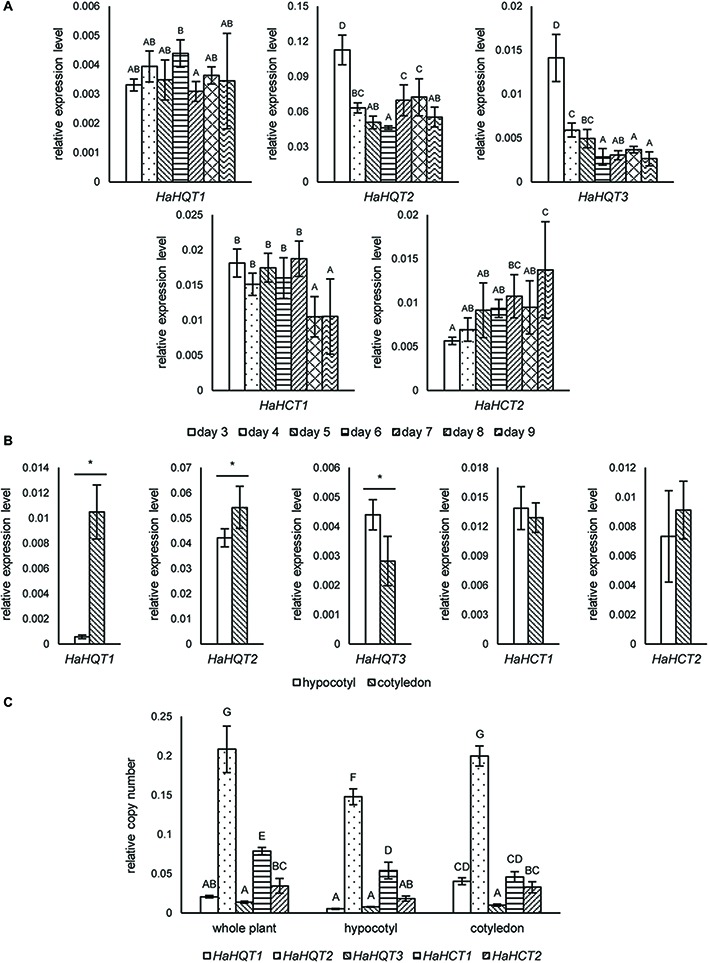
Figure 5.

qRT-PCR analysis of sunflower HQTs and HCTs at different germination time points and tissues. Relative expression levels of sunflower HQTs (HaHQTs) and HCTs (HaHCTs) measured at different time points (days 3–9) during the germination period. Bars represent the mean values ± standard deviation (SD) of five biologically independent replicates; comparisons are shown among different time points within each gene; different alphabets indicate significant differences according to Duncan’s multiple-range test (p < 0.05) (A). Tissue specific gene expression analysis of HaHQTs and HaHCTs sampled at day 5 post-germination; for each gene, comparisons are shown between the hypocotyl and cotyledon; an asterisk (*) above the bars indicates a significant difference between the two tissues (Student’s t test, p < 0.05) (B). Absolute gene expression analysis of HaHQTs and HaHCTs from whole plant, hypocotyl, and cotyledon using digital droplet PCR (ddPCR). Bars represent the mean values ± standard deviation (SD) of five biologically independent replicates; comparisons are shown for all genes among different tissues; different alphabets indicate significant differences according to Duncan’s multiple-range test (p < 0.05) (C).
