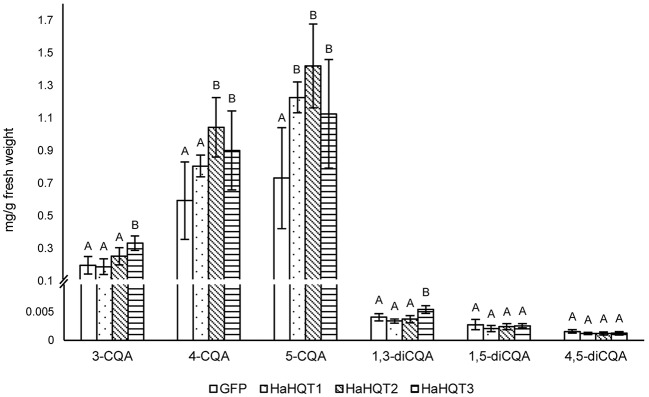
Figure 7.
HPLC profiling of caffeoylquinic acids in Nicotiana benthamiana leaves infiltrated with HaHQTs. Tissue extracts of N. benthamiana leaves infiltrated with GFP (control) and HQTs from sunflower (HaHQT1, HaHQT2, and HaHQT3) were analyzed by HPLC. Bars represent the mean values ± standard deviation (SD) of five biologically independent replicates. Within each caffeoylquinic acid derivative, different alphabets indicate significant differences according to Duncan’s multiple-range test (p < 0.05).

