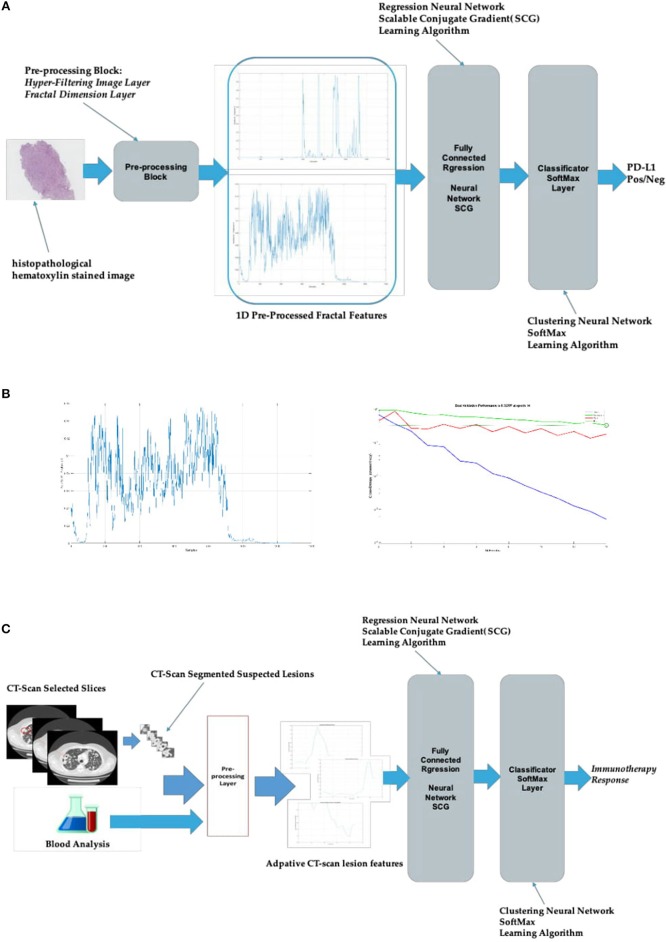
Figure 2.
Bio-inspired system for radiomics and pathomics. (A) Bio-inspired system for pathomics in lung cancer; (B) the diagram on the left shows an example of fractal dimension time–series extracted from a single histopathological hematoxylin stained image. The one on the right illustrates the learning dynamic of the system during the training session: the lower (blue) curve shows the training dynamic (i.e., the progressive error reduction) while the middle (red) and the upper (green) curves show the testing and validation, respectively; (C) bio-inspired system for radiomics in urothelial cancer. The pre-processing input data used arise from CT-scan images and blood analysis data.

