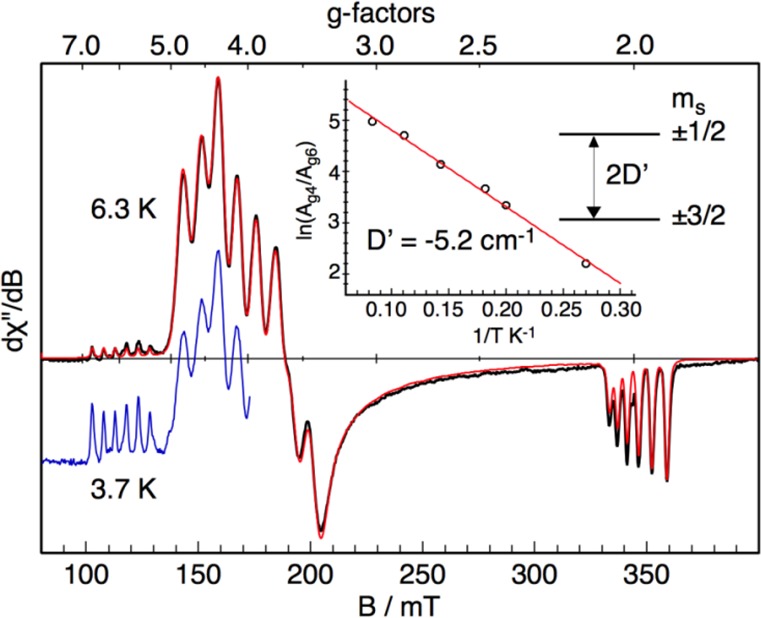
Figure 2.

X-band EPR spectra of 2′ (2 mM) recorded at 6.3 K (black) and at 3.7 K (blue), and the simulation for 6.3 K (red). The simulation yields the following parameters: giso = 1.997(10), D = −5.2(5) cm–1, E/D = 0.03(1), and |Ax,y,z| = 234(10), 225(10), and 142(10) MHz. Note that the sign of the A values cannot determined experimentally. The inset shows the logarithm of the intensity ratio of the derivative signals geff ≈ 4 and geff ≈ 6 as a function of inverse temperature and a fit with the corresponding Boltzmann function (red line). Frequency 9.63595 GHz, power 0.2 mW, modulation 100 kHz/0.75 mT.
