Figure 3.

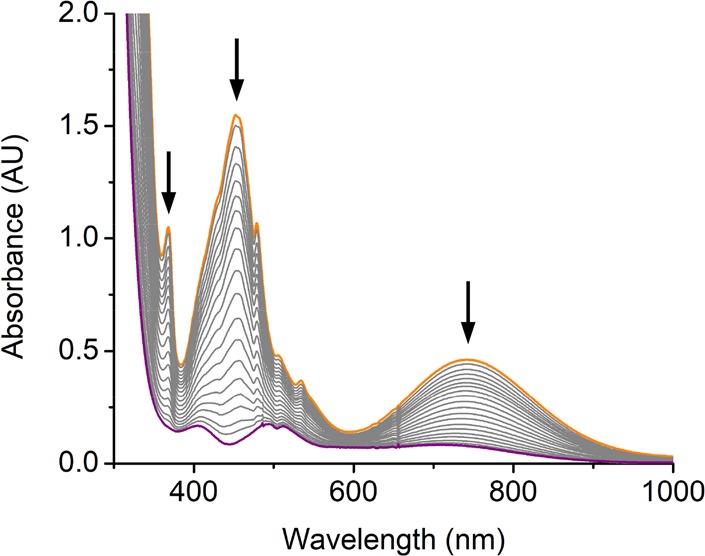
UV–vis spectra change monitored from the reaction of 2′ (orange line, 1 mM) with 10 equiv of TEMPO-H in THF at −90 °C. The purple line represents Mn(BDPBrP)(OOH) (5′) with four absorption bands at 410, 495, 515, and 720 nm.

UV–vis spectra change monitored from the reaction of 2′ (orange line, 1 mM) with 10 equiv of TEMPO-H in THF at −90 °C. The purple line represents Mn(BDPBrP)(OOH) (5′) with four absorption bands at 410, 495, 515, and 720 nm.