
Figure 5.
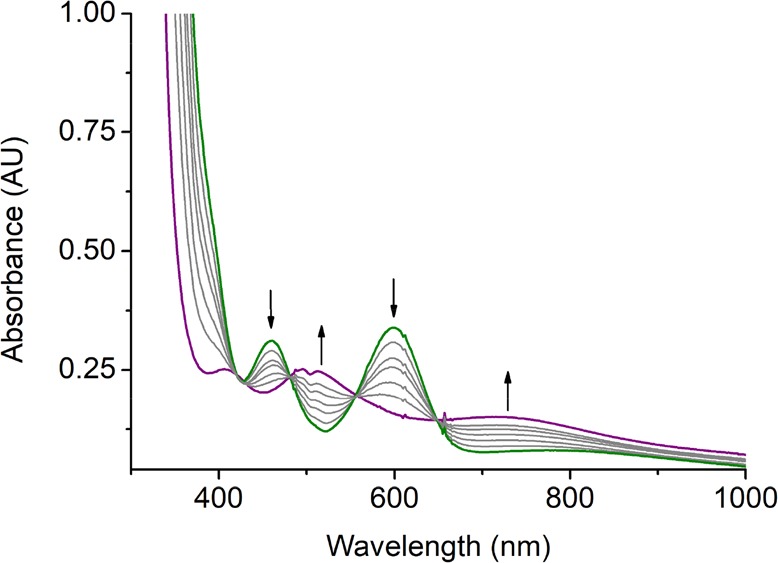
UV–vis spectra change monitored from the reaction of [Mn(BDPBrP)(H2O)]OTf (6′) (green line, 1 mM) with an excess amount of a 2:1 mixture of H2O2 and NEt3 in THF at −90 °C. The purple line represents Mn(BDPBrP)(OOH) (5′).
Official websites use .gov
A
.gov website belongs to an official
government organization in the United States.
Secure .gov websites use HTTPS
A lock (
) or https:// means you've safely
connected to the .gov website. Share sensitive
information only on official, secure websites.
UV–vis spectra change monitored from the reaction of [Mn(BDPBrP)(H2O)]OTf (6′) (green line, 1 mM) with an excess amount of a 2:1 mixture of H2O2 and NEt3 in THF at −90 °C. The purple line represents Mn(BDPBrP)(OOH) (5′).