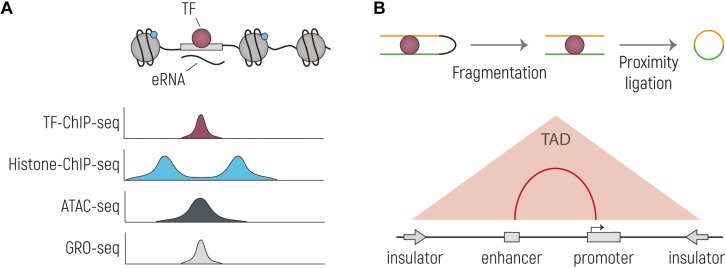
FIGURE 2.
Overview of the main techniques currently used to identify putative enhancer sequences and their interacting genes. (A) Schematic drawing of an TF-bound enhancer, located in nucleosome depleted DNA from which eRNA is transcribed. Below are representative genome browser tracks shown, illustrating expected profiles for the same genetic region. Histone-ChIP-seq is illustrative for marks such as H3K27ac and H3K4me1. (B) Cartoon representing the main steps of the workflow of Chromosome conformation capture technologies: nuclei are cross-linked, chromatin is then digested and re-ligated by proximity ligation. The two stretches of DNA that are normally located far away from each other (yellow and green), are now ligated together and can be tested by PCR or sequencing. In the bottom part is indicated the output of the experiment, with which TADs and enhancer-promoter interactions can be identified.

