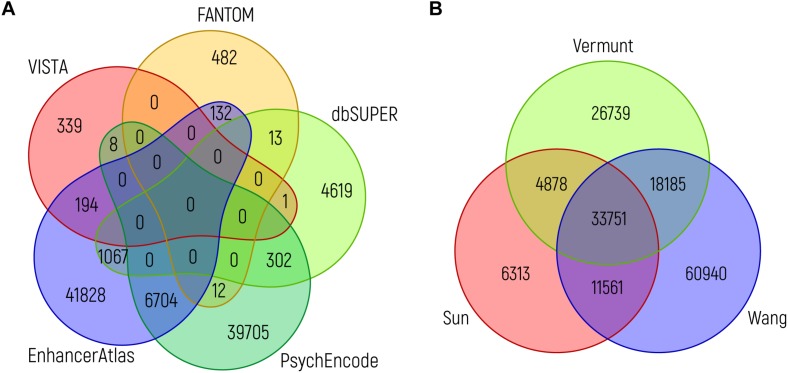
FIGURE 4.
Overlap between brain enhancer databases. (A) Venn diagram showing the overlap between brain enhancers (in genome build hg19) from different databases: VISTA (n = 542) (Visel et al., 2007), dbSUPER (n = 6002) (Khan and Zhang, 2016), FANTOM5 (n = 639) (Andersson et al., 2014), PsychENCODE (n = 46731; the 46735 enhancers mentioned in the text are in genome build hg38 and the difference of four loci is due to liftover to hg19) (Amiri et al., 2018) and EnhancerAtlas 2.0 (n = 49925) (Gao et al., 2016). (B) Venn diagram showing the overlap between ChIP-seq peaks for H3K27ac from adult brain, as identified in three studies: Sun (n = 56503) (Sun et al., 2016), Vermunt (n = 83553) (Vermunt et al., 2014), and Wang (n = 124437) (Wang D. et al., 2018). The intersection between different sources (in the same order as above) was performed using bedops and bedtools. In both graphs, the minimum overlap of a single nucleotide is required.

