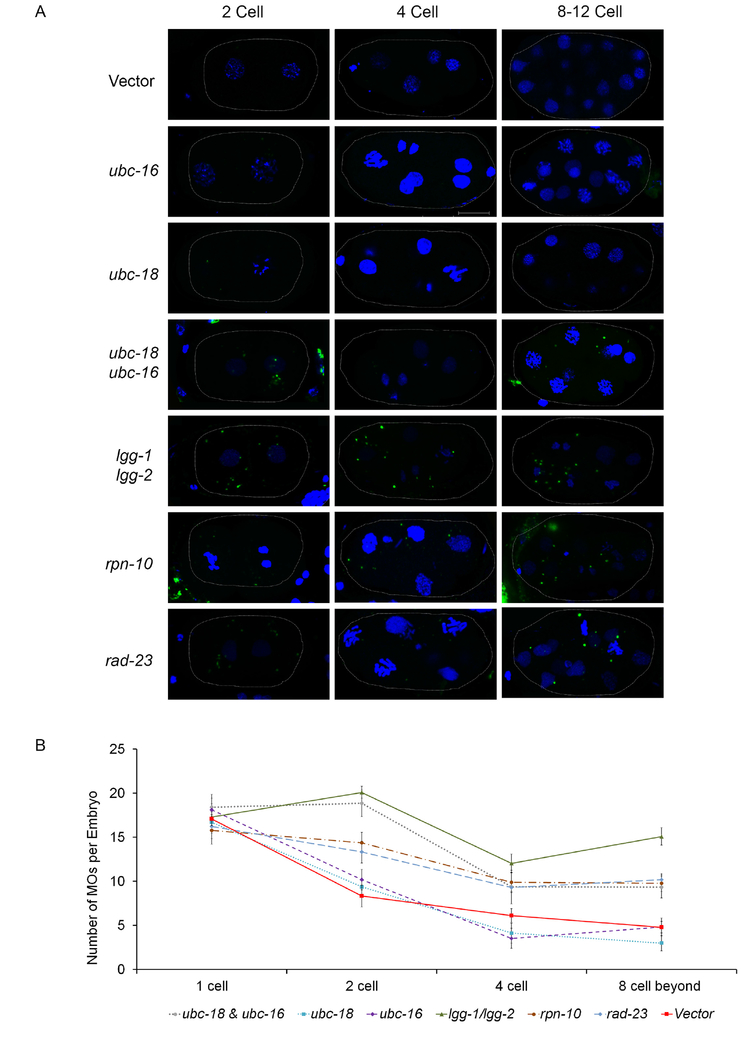
Figure 2. Reduction in MO ubiquitination correlates with a delay in their removal.
Embryos stained with an antibody that recognizes MOs were imaged and analyzed for the number of MOs per embryo. (A) Representative embryos from control and RNAi treatments. Maximum intensity z-projections of confocal images of embryos stained for MOs using the 1CB4 antibody (green) and DAPI for DNA (blue). In the vector control, MO numbers are reduced in 4- and 8-cell embryos. This reduction is not seen after RNAi treatment for ubc-18/16 or lgg-1/2. Scale bar 10 μm. (B) MOs were counted in 10 embryos for each stage. Error bars in the graph represent the mean ± s.e.m. RNAi knockdowns were compared to vector control and significant differences between were determined by unpaired t test. ubc-18/ubc-16 knockdown treatment had a p<0.001, lgg-1/2, rpn-10 and rad-23 had a p<0.0001. ubc-18 and ubc-16 treatments were not statistically different from the control.

