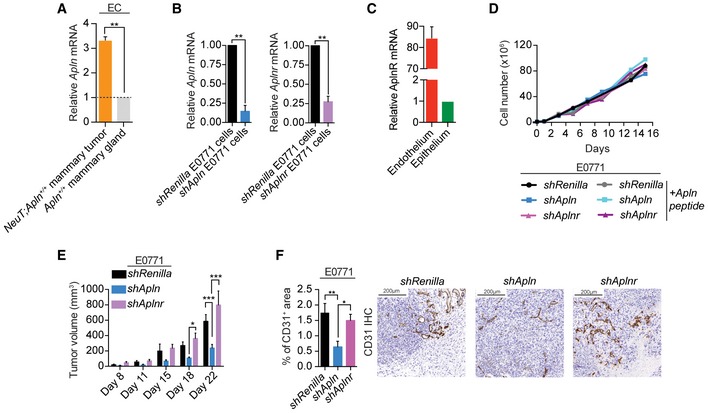
RT‐qPCR of Apelin (Apln) expression in endothelial cells (ECs) isolated from NeuT;Apln
+/+ tumors, normal Apln
+/+ mammary glands. Data are shown as relative mRNA levels normalized to the normal mammary gland endothelium (set to 1) ± SEM. n = 2 per cohort; **P < 0.01, t‐test.
RT‐qPCR of Apln and Aplnr in control E0771 mammary cancer cells (shRenilla) and Apelin or Apelin receptor‐depleted E0771 cells (shApln and shAplnr, respectively). Data are shown as relative mRNA levels normalized to control E0771 cells (set to 1) ± SEM. n = 2 per cohort; **P < 0.01; t‐test.
Relative levels of AplnR mRNA (mean ± SEM) in isolated tumor endothelial cells compared to tumor epithelial cells from NeuT‐driven Apln
+/+ mouse mammary tumors; n = 4 per cohort. Data are shown as relative mRNA levels normalized to epithelial cells (set to 1) ± SEM.
In vitro growth curves of shRenilla, shApln or shAplnr E0771 cells in the absence or presence of an active Apelin peptide (AplnPyr13, 1000 nM). No difference in growth was observed. A representative experiment is shown.
Tumor volume, followed over time, of orthotopically injected shRenilla, shApln, and shAplnr E0771 cells. Data were determined using calipers and are shown as mean tumor volumes ± SEM. n = 4 syngeneic C57BL/6J mice per cohort; *P < 0.05, ***P < 0.001, two‐way ANOVA.
Quantification (mean percentages ± SEM) and representative immunohistochemistry of CD31+ area in shRenilla (n = 6), shApln (n = 6) or shAplnr (n = 7) E0771 mammary tumors in C57BL/6J wild‐type mice, analyzed on day 12 post‐orthotopic injection. *P < 0.05, **P < 0.01; one‐way ANOVA. Scale bars = 200 μm.

