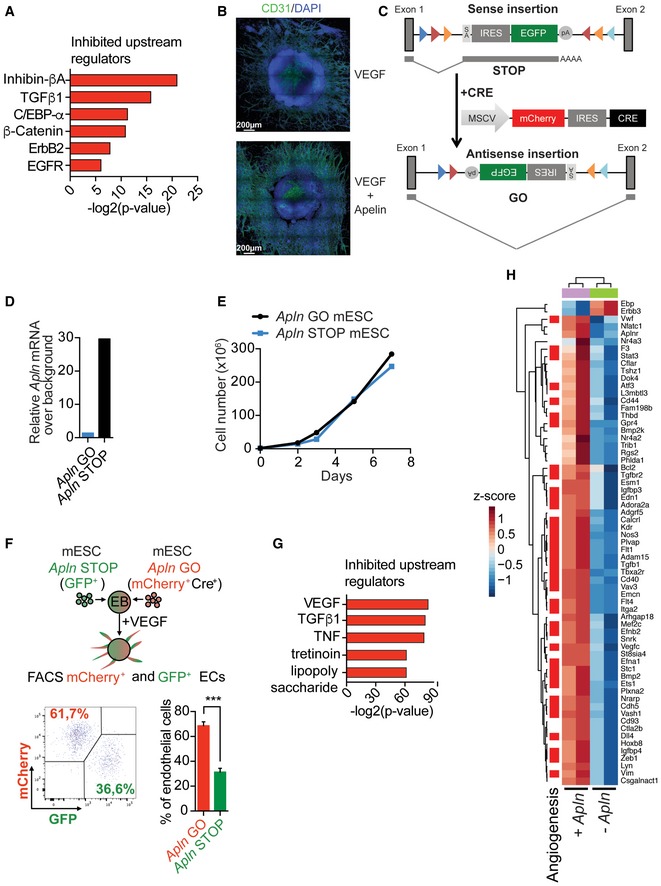
Figure EV3. Gene expression analysis in Apelin‐depleted tumor endothelial cells and endothelial sprouts.

- Ingenuity pathway analysis for upstream regulators predicted to be inhibited based on significantly differentially expressed genes from RNA‐Seq transcriptome analysis of CD31+/CD105+ endothelial cells sorted from tumors established by E0771 shRenilla (n = 6) or shApln (n = 3) cells orthotopically injected into C57BL/6J Apln +/+ or Apln −/− mice, respectively. Tumors were harvested day 25 post‐injection.
- Representative immunofluorescence images of sprouting embryoid bodies (EBs) derived from CCE mouse embryonic stem cells (mESCs) after 6 days of sprouting initiation. EBs were treated with VEGF (30 ng/ml) only or VEGF (30 ng/ml) followed by AplnPyr13 (1,000 nM) upon sprouting initiation. Scale bars = 200 μm.
- Apelin knockout strategy and reversion of knockout by Cre addition in haploid murine embryonic stem cells (mESCs). If in sense, integration of the splice acceptor into an intron results in gene disruption due to splicing (STOP); after reverting the cassette into antisense by Cre addition, the cassette is spliced out and gene transcription occurs from the “repaired” locus (GO). SA: splicing acceptor; pA: polyA.
- RT‐qPCR for Apelin in mESCs with Apln STOP and Apln GO integrations of the splice acceptor as shown in Appendix Fig S3C.
- Growth curve of Apln GO mESCs and their genetically repaired sister mESCs (Apln STOP). A representative experiment is shown.
- Percentages (mean ± SEM) of CD31+ ECs evaluated by FACS from mosaic EBs formed from mESCs of 1:1 mixed Apelin GO (mCherry+Cre+): Apelin STOP (GFP+). ***P < 0.001, Mann–Whitney test; n = 4 per cohort. Representative FACS analysis dot plot is shown.
- Ingenuity pathway analysis (IPA) predicting inhibited upstream regulators based on differentially expressed genes in RNA‐Seq analysis from CD31+ endothelial cells (ECs) isolated from sprouting EBs from either repaired Apln GO cells stimulated with VEGF (30 ng/ml) and Apelin (1,000 nM; full presence of Apelin) or Apln STOP sister cells stimulated with VEGF and control DMSO (total absence of Apelin).
- Heatmap of the genes downstream of VEGF (Appendix Fig S3F) comparing differentially expressed genes in RNA‐Seq analysis from CD31+ endothelial cells isolated from sprouting EBs from either repaired Apln GO mESCs stimulated with VEGF (30 ng/ml) and Apelin (1,000 nM; +Apln) or Apln STOP sister cells stimulated with VEGF and control DMSO (−Apln).
