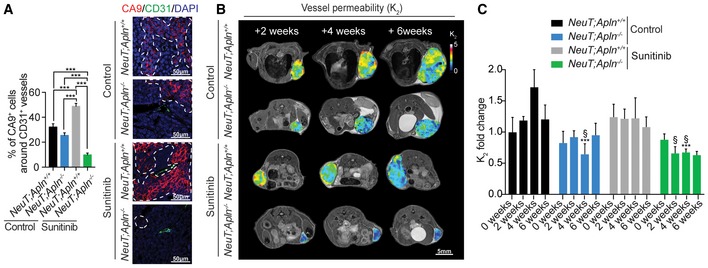
Figure 5. Apelin inactivation reduces sunitinib therapy‐induced hypoxia and vessel permeability.

-
APercentages of CA9+ cells adjacent to CD31+ tumor blood vessels (mean ± SEM) in untreated (control) and sunitinib‐treated NeuT;Apln +/+ and NeuT;Apln −/− mice, 6 weeks after mammary tumors were size‐matched. NeuT;Apln +/+ control (n = 4), NeuT;Apln −/− control (n = 4), NeuT;Apln +/+ sunitinib (n = 4), NeuT;Apln −/− sunitinib (n = 4); 100–200 peri‐vascular intra‐tumoral regions per group were counted. ***P < 0.001; one‐way ANOVA. Right panels show representative immunofluorescent images. Areas limited by dotted white lines indicate CA9+ areas. Scale bars = 50 μm.
-
B, C(B) Representative MRI images; scale bar = 5 mm and (C) quantification (mean ± SEM) of vessel permeability (K 2) in NeuT+ mammary tumors followed over time. Treatments and genotypes are indicated. NeuT;Apln +/+ control (n = 4), NeuT;Apln −/− control (n = 5), NeuT;Apln +/+ sunitinib (n = 4), NeuT;Apln −/− sunitinib (n = 5); ***P < 0.001, compared to untreated control NeuT;Apln +/+ mice and § P < 0.05 compared to sunitinib‐treated NeuT;Apln +/+ mice; two‐way ANOVA. Of note, in NeuT;Apln +/+ mice, only two tumors could be analyzed after 6 weeks as some mice had to be sacrificed due to the large tumor sizes following ethical guidelines. Thus, we did not perform any statistical analysis on the 6 weeks time points.
