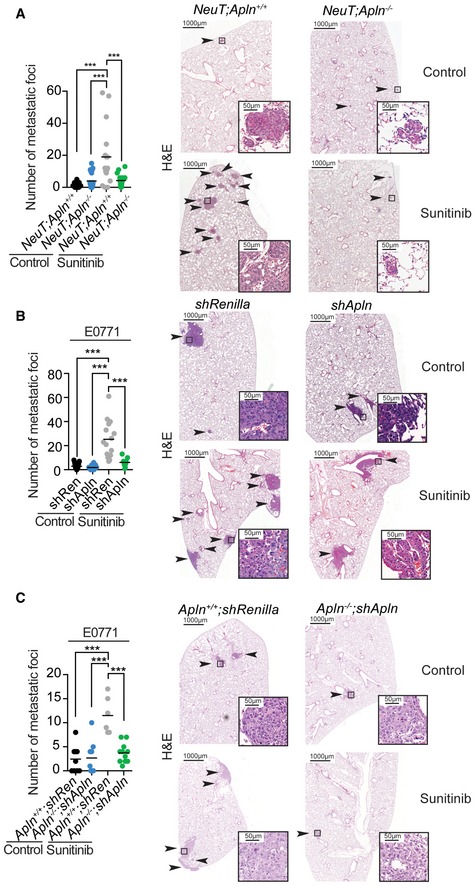
B, CNumber of metastatic lung foci per lung section from 1 to 1.5 cm3 size‐matched E0771 control (shRenilla) and Apelin‐depleted (shApln) E0771 tumors orthotopically injected into C57BL/6J Apln
+/+ (B) or orthotopically injected into C57BL/6J Apln
+/+ or Apln
−/− mice (C). Mice were either left untreated (control) or treated with sunitinib (60 mg/kg, starting at day 5 after tumor injection, five times a week). Data of individual lung sections and means (black bars) are shown. Right panels show representative H&E images, where black arrows and insets indicate metastatic foci. Scale bars = 1,000 μm (large panels) and 50 μm (insets). E0771 shRenilla control (n = 7), E0771 shApln control (n = 4), E0771 shRenilla sunitinib (n = 5), E0771 shApln sunitinib (n = 3) (B) or Apln
+/+
shRenilla control (n = 3), Apln
−/−
shApln control (n = 3), Apln
+/+
shRenilla sunitinib (n = 2), Apln
−/−
shApln sunitinib (n = 3) (C) and three sections per lung were analyzed. **P < 0.01; ***P < 0.001; one‐way ANOVA.

