
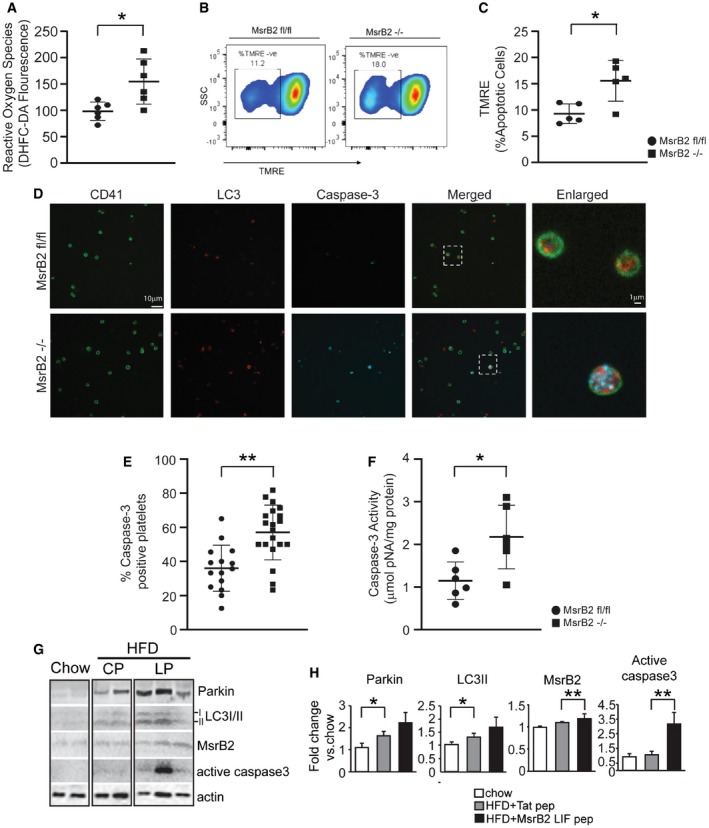
Figure 3. Platelet‐specific deletion of MsrB2 leads to increased oxidative stress and intraplatelet apoptosis.
-
ALevels of reactive oxygen species (ROS) quantified in the platelets using the fluorescent dye DCFH‐DA (ROS, *P = 0.0139; MsrB2 fl/fl n = 5, MsrB2−/− n = 6).
-
B, CRepresentative image and quantification of mitochondrial apoptosis, measured in freshly isolated platelets from the MsrB2 knockout and age‐matched floxed mice. Results are expressed as percentage of apoptotic cells (TMRE, *P = 0.0118; MsrB2 fl/fl n = 5, MsrB2−/− n = 5).
-
DRepresentative images showing the intraplatelet expression of LC3 and active caspase‐3 in CD41‐stained platelets from the KO mice using fluorescent‐labeled antibodies against the respective proteins of interest. Magnification: 100×. The rightmost panel represents zoom‐in on an individual platelet showing the colocalization and expression of LC3 and active caspase‐3.
-
EGraph indicates platelets positive for active caspase‐3 signal. The y‐axis indicates percentage of caspase‐3‐positive cells from total cells calculated from n = 10 independent images per sample (active caspase‐3 signal, **P = 0.0003).
-
FIntracellular caspase‐3 activity measured in freshly isolated platelets using the chromophore Ac‐DEVD‐pNA. Experiments performed in a minimum of n = 6 samples per group. Values expressed as mean ± SEM (caspase‐3 activity, *P = 0.0157)
-
G, HWestern blot analysis of Parkin, LC3I/II, MsrB2, and active caspase‐3 in platelets after cell penetration peptide injection in chow and HFD mice. Control peptide (CP), LIF peptide (Foroud et al, 2003). Quantification analysis of individual band intensity (Parkin, *P = 0.02964; LC3II, *P = 0.03200; MsrB2, **P = 0.0059; active caspase‐3, *P = 0.0368 vs. chow or HFD group; each group n = 3). Actin served as the loading control.