-
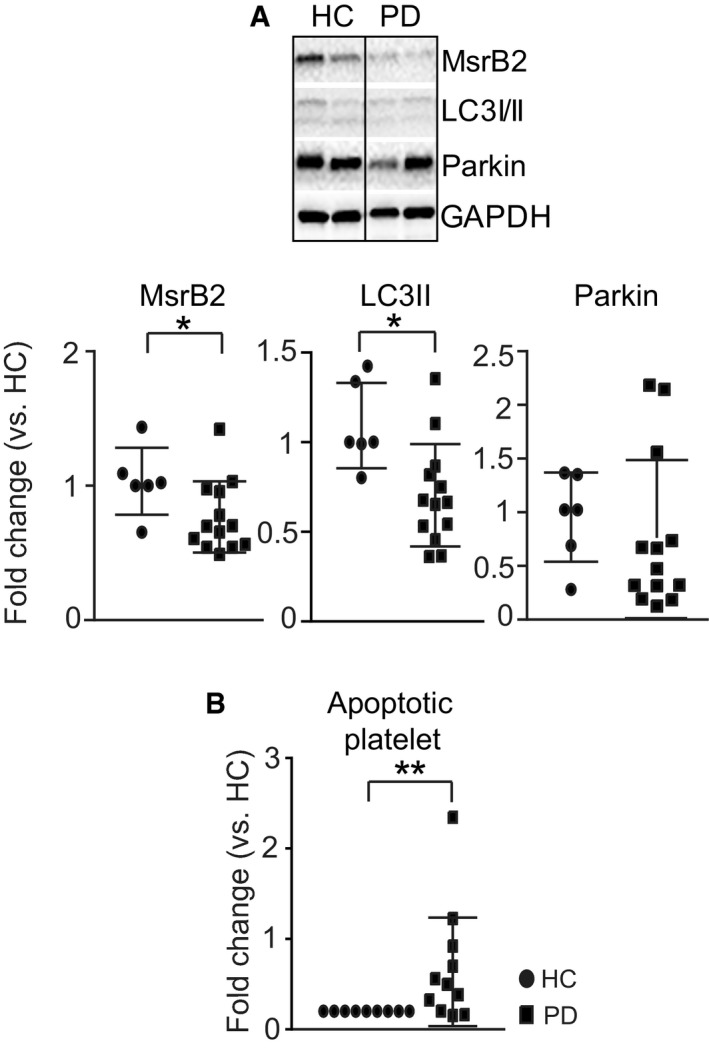
A
Representative Western blot analysis of MsrB2, LC3I/II, and Parkin using Parkinson's disease (PD) platelets. Quantification analysis of individual band intensity (MsrB2, *P = 0.0255; LC3II, *P = 0.0101 vs. HC (n = 5) and PD (n = 12)). GAPDH served as the loading control (mean ± SD).
-
B
Platelet apoptosis (Annexin V) was measured by flow cytometry analysis in HC (n = 9) and PD (n = 13) platelets (**P < 0.01 vs. HC) (mean ± SD).
Data information: The nonparametric
t‐test was performed for comparisons of two groups. Analysis was performed with Prism software (GraphPad Software, Inc., La Jolla, CA). A difference of
P < 0.05 was considered significant.