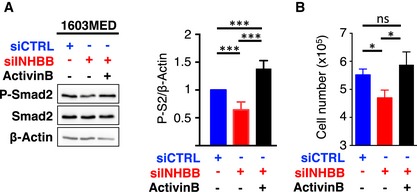
Figure EV2. An autocrine stimulation by ActivinB in the 1603MED cell line.

-
A, BThe level of phosphorylated Smad2 (P‐Smad2) and total Smad2 (Smad2) was assessed by immunoblot, and β‐actin was used as a loading control in 1603MED cells transfected with the indicated control siRNA (siCTRL) or targeting INHBB (siINHBB). Rescue experiment was performed by adding exogenous ActivinB. Lysates were prepared 48 h after transfection. Right panel represents relative quantifications of the P‐S2/β‐actin ratio. Note that P‐Smad2/β‐actin quantification is identical to that of in Fig 2D. P‐Smad2 to total Smad normalization is provided on Appendix Fig S5. (B) Number of viable 1603MED cells 2 days after transfection with either siCTRL (blue) or siINHBB (red). Rescue was assessed upon ActivinB stimulation (black). The P‐values were determined by unpaired t‐test. *P < 0.05, ***P < 0.001. Bars represent the mean ± SD. Number of replicates is n ≥ 3. The exact P‐values and number of replicates are indicated in Appendix Table S5.
Source data are available online for this figure.
