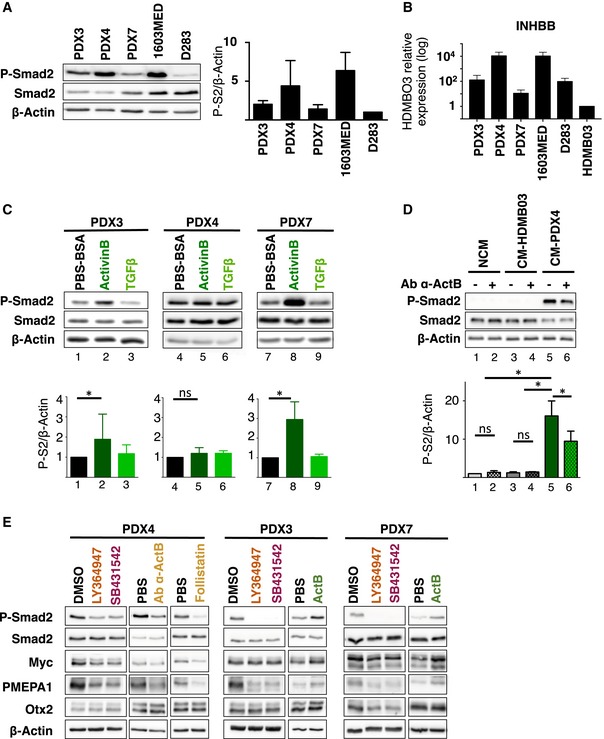
Figure 6. Activated TGFβ/ActivinB signaling in group 3 MB‐PDXs.

-
AImmunoblot analysis of phosphorylated Smad2 (P‐Smad2) in Group 3 MB cell lines and PDXs. The level of total Smad2 (Smad2) was assessed, and β‐actin was used as a loading control. Quantification of P‐Smad2 (P‐S2) to β‐actin is shown on right panel.
-
BExpression of INHBB in Group 3 MB cell lines and PDXs relative to HDMB03 (set at 1) by RT–qPCR.
-
CImmunoblot of phosphorylated Smad2 (P‐Smad2), total Smad2, and β‐actin upon ActivinB or TGFβ stimulation for 1 h. Quantification of P‐Smad2 (P‐S2) to β‐actin is shown below.
-
DConditioned media experiments were performed on HDMB03 MB cell line. Phosphorylation of Smad2 (P‐Smad2) was analyzed by immunoblot upon treatment with either non‐conditioned media (NCM), media conditioned with HDMB03 cells (CM‐HDMB03), or media conditioned on PDX4 cells (CM‐PDX4). Pre‐incubation with blocking antibody against ActivinB (Ab α‐ActB) or with vehicle was performed before HDMB03 cell‐line treatment as indicated. Quantification of P‐Smad2 (P‐S2) to β‐actin is shown below.
-
EImmunoblots of phosphorylated Smad2 (P‐Smad2), total Smad2, MYC, PMEPA1, OTX2, and β‐actin were performed on extracts from cell cultures of PDX4, PDX3, and PDX7 treated with either DMSO (vehicle), LY364947, SB431542, blocking antibody against ActivinB (Ab α‐ActB), follistatin, PBS, or ActivinB for 24 h. WB quantification is depicted in Appendix Fig S4C.
