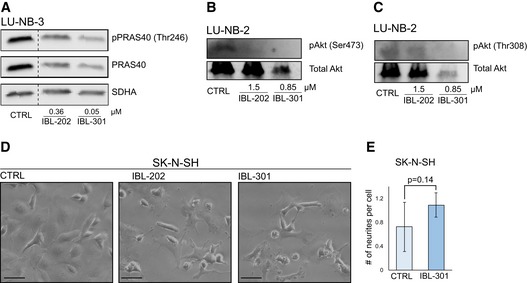
Figure EV1. Multikinase inhibitors target downstream signaling pathways.

-
A–CWestern blot analyses of downstream signaling protein pPRAS40 (A), pAkt(Ser473) (B), and pAkt(Thr308) (C) expression in LU‐NB‐3 and LU‐NB‐2 PDX cells after treatment with IBL‐202 or IBL‐301 at indicated concentrations for 48 h. PRAS40, total Akt, and SDHA levels were used as loading controls.
-
DBrightfield photomicrographs of SK‐N‐SH cells treated with 0.36 μM IBL‐202 or 0.05 μM IBL‐301 for 48 h. Scale bars represent 100 μm.
-
EQuantification of neurite outgrowth presented as number of neurites/cell in SK‐N‐SH cells treated with 0.05 μM IBL‐301. Representative areas (n = 4 and n = 7 for CTRL and IBL‐301, respectively) were used, and n = 249 and n = 245 cells/condition for CTRL and IBL‐301, respectively, were counted. Values are reported as mean ± SEM. Statistical significance was determined by two‐sided Student's t‐test. P = 0.14.
Source data are available online for this figure.
