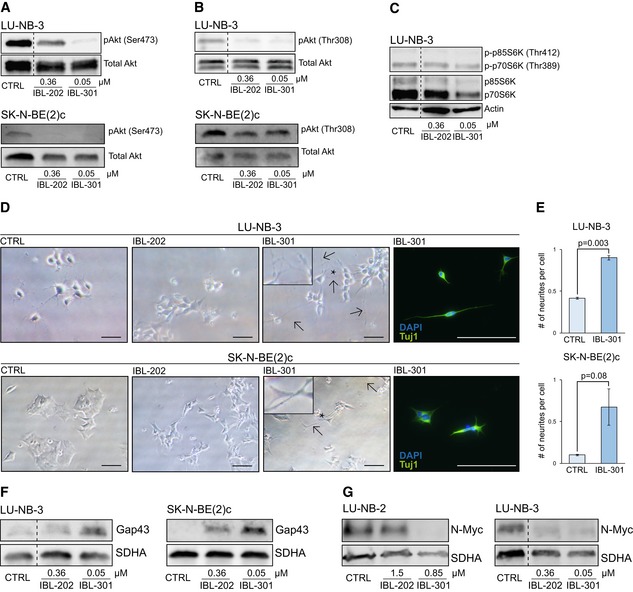
Neuroblastoma PDX and SK‐N‐BE(2)c cells treated with IBL inhibitors at indicated concentrations for 48 h.
-
A, B
pAkt [at Ser473 (A) and Thr308 (B) sites] levels in LU‐NB‐3 and SK‐N‐BE(2)c cells determined by Western blotting. Total Akt levels were used as loading control.
-
C
p‐p70S6K and p‐p85S6K levels in LU‐NB‐3 cells determined by Western blotting. Actin, p70S6K, and p85S6K levels were used as loading controls.
-
D
Brightfield photomicrographs of LU‐NB‐3 and SK‐N‐BE(2)c cells treated with 0.36 μM IBL‐202 or 0.05 μM IBL‐301. Scale bars represent 100 μm (LU‐NB‐3) or 200 μm (SK‐N‐BE(2)c). Arrows indicate neurite outgrowths, and asterisks indicate where inserts are magnified. IBL‐301‐treated cells were stained for Tuj1. DAPI was used to visualize nuclei.
-
E
Quantification of neurite outgrowth presented as number of neurites/cell in LU‐NB‐3 PDX and SK‐N‐BE(2) cells treated with IBL‐301. For LU‐NB‐3 PDX cells, representative areas (n = 2) were used and n = 344 and n = 240 cells/condition for CTRL and IBL‐301, respectively, were counted. For SK‐N‐BE(2)c cells, representative areas (n = 2 and n = 3 for CTRL and IBL‐301, respectively) were used and n = 141 and n = 130 cells/condition for CTRL and IBL‐301, respectively, were counted. Values are reported as mean ± SEM. Statistical significance was determined by two‐sided Student's t‐test. P = 0.003 for LU‐NB‐3 and P = 0.08 for SK‐N‐BE(2)c.
-
F
Gap43 protein levels in LU‐NB‐3 and SK‐N‐BE(2)c cells determined by Western blotting. SDHA levels were used as loading control.
-
G
N‐Myc levels in LU‐NB‐2 and LU‐NB‐3 cells determined by Western blotting. SDHA levels were used as loading control.

