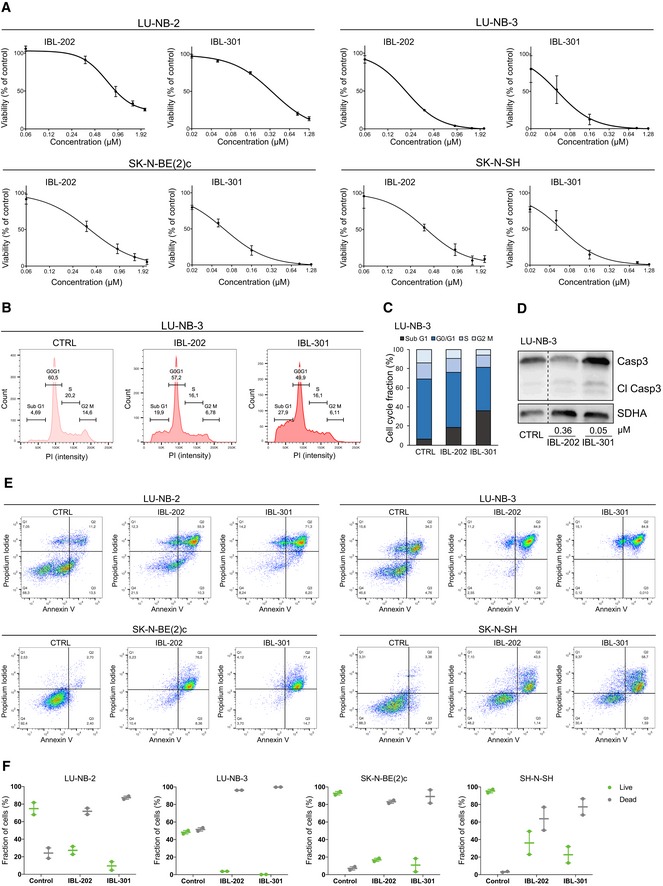
Figure 4. Treatment with multikinase inhibitors results in cell death.

-
AViability of IBL‐202‐ or IBL‐301‐treated cells determined by CellTiter‐Glo. Values are reported as mean ± SEM. n = 2 replicates for LU‐NB‐2 and LU‐NB‐3, n = 3 replicates for SK‐N‐BE(2)c and SK‐N‐SH.
-
B, CCell cycle distribution of LU‐NB‐3 cells determined by flow cytometry. Bars show mean values from two independent experiments.
-
DCleaved caspase‐3 (Cl Casp3) levels in LU‐NB‐3 cells determined by Western blotting. SDHA levels were used as loading control.
-
EFlow cytometry analyses of Annexin V and PI stainings following treatment with 360 nM IBL‐202 or 50 nM IBL‐301.
-
FQuantification of live and dead cells from the Annexin V/PI stainings. Dead cells = PI positive, live cells = PI negative. Dot plots from two independent experiments and error bars represent SEM.
Source data are available online for this figure.
