
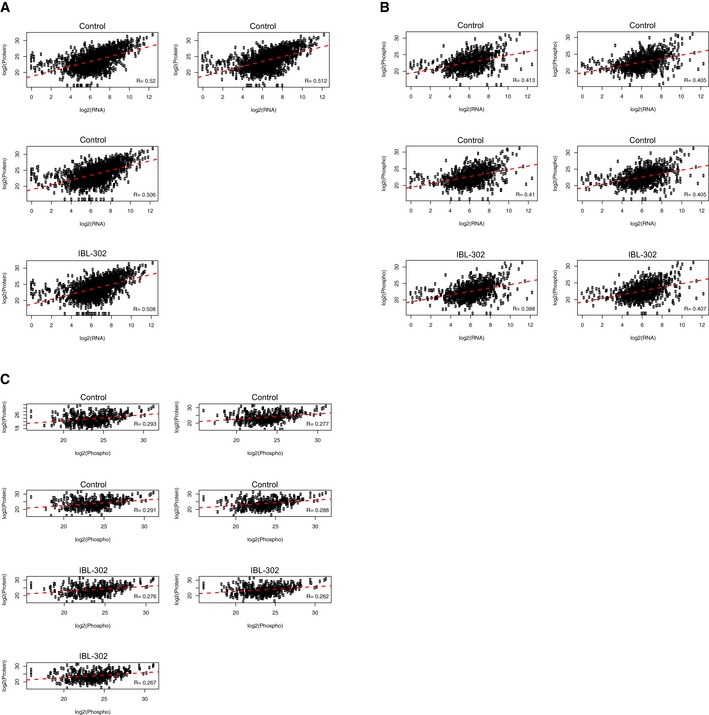
Figure EV4. Correlations between RNA, protein, and phospho‐protein expression.
-
A–CCross‐platform sample correlation of expression levels between RNAseq and mass spectrometry (A), RNAseq and mass spectrometry phospho‐proteome (B), and mass spectrometry proteome and mass spectrometry phospho‐proteome (C) data. Pearson's correlation coefficients are displayed.