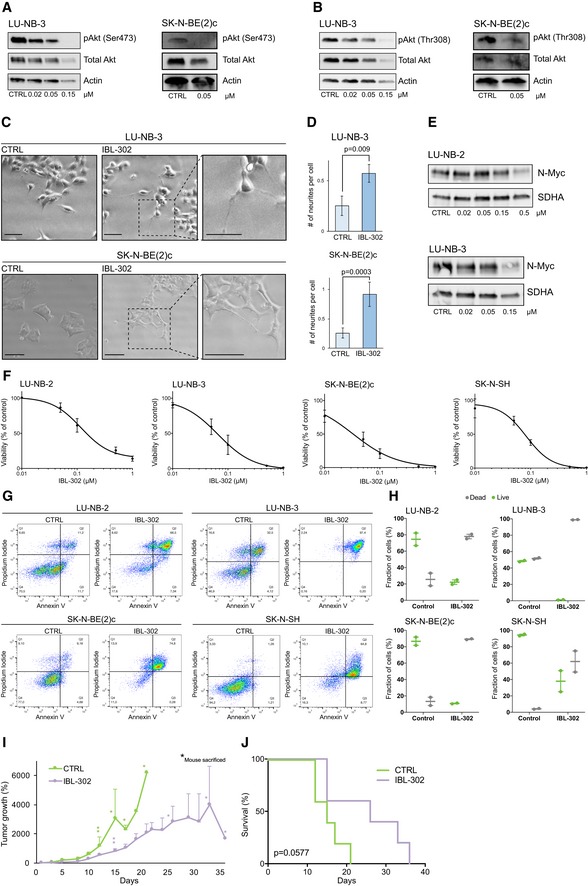
Neuroblastoma cells were treated with indicated concentrations of IBL‐302 for 48 h (pAkt and N‐Myc expression, photomicrographs, and flow cytometry) or 72 h (cell viability, (F)).
-
A
Expression of pAkt(Ser473) in LU‐NB‐3 and SK‐N‐BE(2)c cells. Total Akt and actin were used as loading controls.
-
B
Expression of pAkt(Thr308) in LU‐NB‐3 and SK‐N‐BE(2)c cells. Total Akt and actin were used as loading controls.
-
C
Brightfield photomicrographs of LU‐NB‐3 and SK‐N‐BE(2)c cells treated with 50 nM IBL‐302. Scale bars represent 100 μm (LU‐NB‐3) or 200 μm (SK‐N‐BE(2)c).
-
D
Quantification of neurite outgrowth presented as number of neurites/cell in LU‐NB‐3 PDX and SK‐N‐BE(2)c cells treated with IBL‐302. For LU‐NB‐3 PDX cells, representative areas (n = 4) were used and n = 460 and n = 216 cells/condition for CTRL and IBL‐302, respectively, were counted. For SK‐N‐BE(2)c cells, representative areas (n = 5 and n = 7 for CTRL and IBL‐302, respectively) were used and n = 124 and n = 260 cells/condition for CTRL and IBL‐301, respectively, were counted. Values are reported as mean ± SEM. Statistical significance was determined by two‐sided Student's t‐test. P = 0.009 for LU‐NB‐3 and P = 0.0003 for SK‐N‐BE(2)c.
-
E
N‐Myc protein expression determined by Western blotting. SDHA was used as loading control.
-
F
Cell viability determined by CellTiter‐Glo. Values are reported as mean ± SEM. n = 3.
-
G
Flow cytometry analyses of Annexin V and PI stainings following treatment with 50 nM IBL‐302.
-
H
Quantification of live and dead cells. Dead cells = PI positive, live cells = PI negative. Dot plots from two independent experiments and error bars represent SEM.
-
I
Neuroblastoma SK‐N‐BE(2)c carrying mice (n = 5 in each group) were treated with vehicle (CTRL) or 40 mg/kg IBL‐302 for up to 35 days, and tumor growth was followed over time. Asterisks indicate each occasion a mouse within that particular group was sacrificed. Values are reported as mean ± SEM.
-
J
Kaplan–Meier survival curves comparing mice treated with vehicle (CTRL) or IBL‐302. Log‐rank test was used to determine statistical significance. P = 0.0577. n = 5 in each group.

