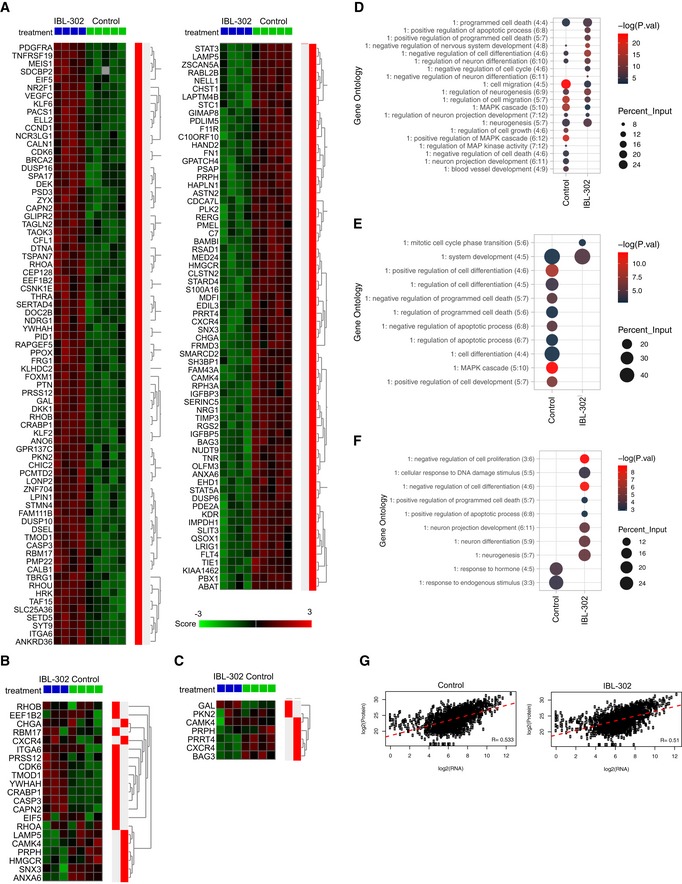
Figure 7. Tumor‐related processes are affected by IBL‐302 treatment.

-
A–CHeat map of significantly differentially expressed genes across treatment groups from RNAseq data (FDR < 0.1) (A). Genes defined as differentially expressed that were also present in MS and phospho‐MS are visualized in (B) and (C), respectively.
-
DGene ontology generated from significantly altered genes from RNAseq data. −log(P‐values) and percent of input gene/protein lists that overlap with the specified ontology are displayed.
-
EGene ontology generated from significantly altered proteins from mass spectrometry proteome data. −log(P‐values) and percent of input gene/protein lists that overlap with the specified ontology are displayed.
-
FGene ontology generated from significantly altered phospho‐proteins from mass spectrometry phospho‐proteome data. −log(P‐values) and percent of input gene/protein lists that overlap with the specified ontology are displayed.
-
GCross‐platform sample correlations of RNAseq and mass spectrometry proteome data. Pearson's correlation coefficients are displayed.
