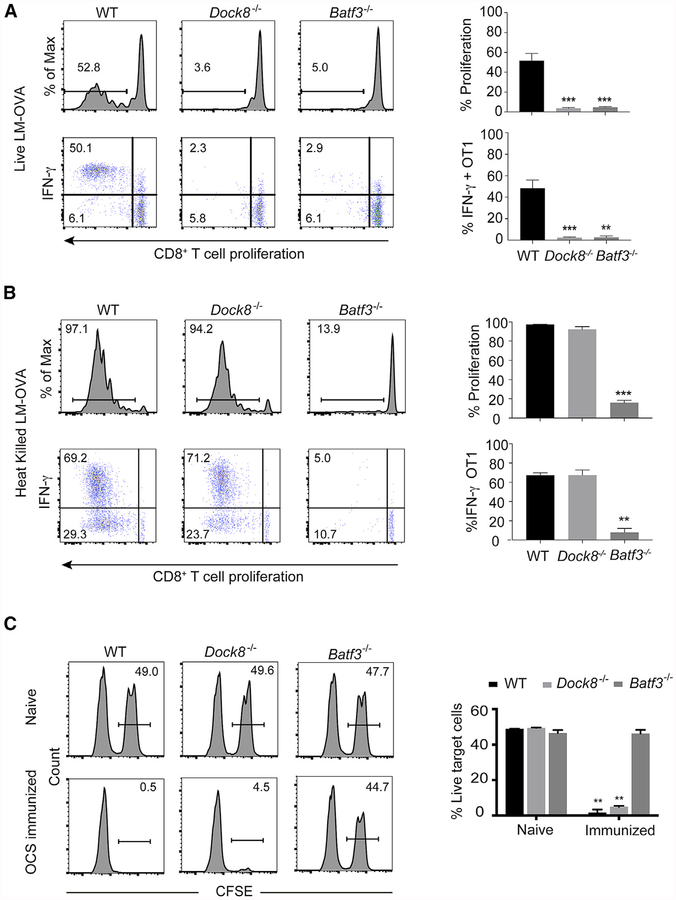
Figure 1. Dock8−/− Mice Have an Impaired CD8+ T Cell Response to Live Listeria Infection but Intact CTL Effector Responses to Inert Antigens.
(A and B) 1 × 10⁶ CFSE-labeled OT-1 T cells were adoptively transferred into WT, Dock8−/−, and Batf3−/− mice. One day later, the recipient mice were i.v. infected with 103 live rLm-OVA (A) or with 108 HKLm-OVA (B). After 3 days, the mice were sacrificed, and the spleens were collected for OT-1 cell proliferation and IFNγ production analysis by flow cytometry. Results are representative of five independent experiments with n = 3 or 4/group.
(C) Wild-type (WT), Dock8−/−, and Batf3−/− mice were i.v. injected with 107 irradiated OVA-coated MHC class l-deficient splenocytes. 5 days later, these mice were i.v. injected with 107 OVA peptide pulsed target cells (CFSEhi) and 107 non-pulsed cells (CFSEI0). 16 h after target cell injection, the percentage of CFSEhl cells in the spleen was evaluated by flow cytometry. Results are representative of three independent experiments with n = 3 or 4/group.
Numbers indicate the percentage of proliferating cells or cytokine producers in the indicated gates. Data are means ± SD. **p < 0.01, ***p < 0.001 (compared with the WT in A and B and Batf3−/− in C). See also Figure S1.

